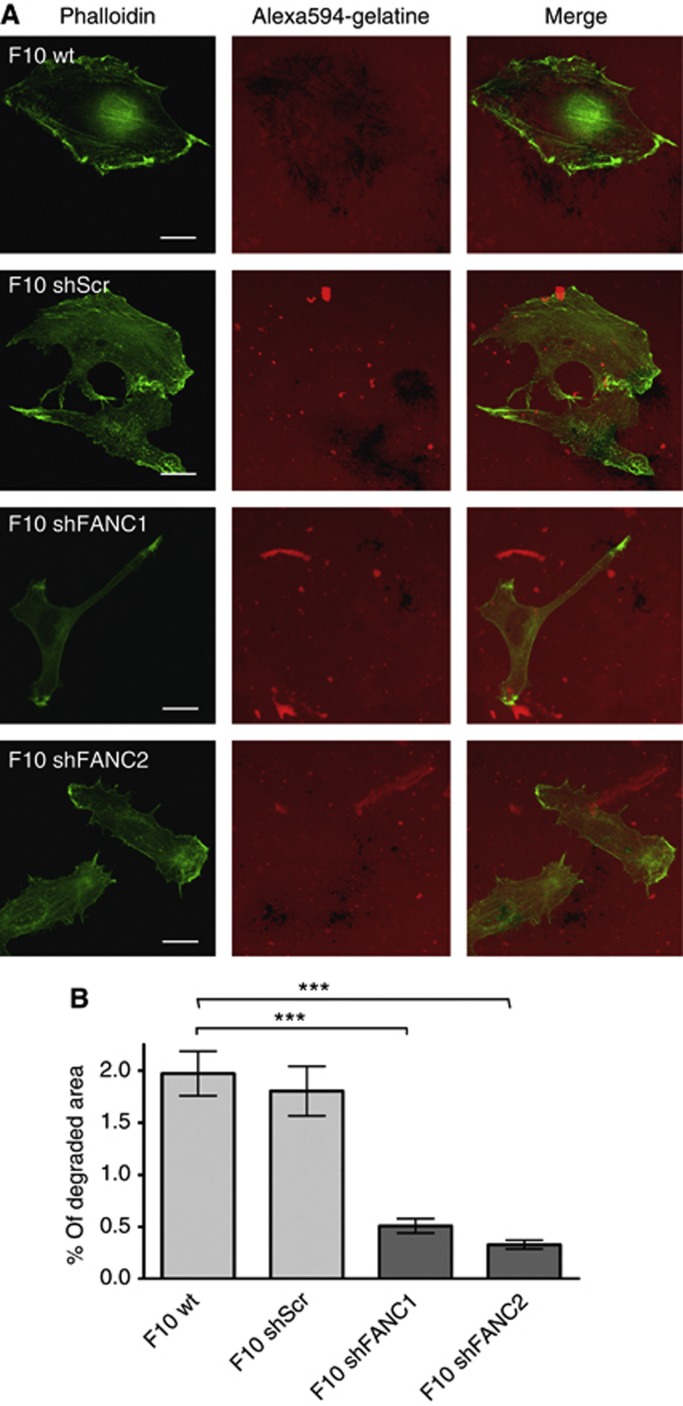
Figure 5.
The degradation of ECM is reduced in FAN-deficient B16 cells. (A) Degradation assay of B16 F10 mouse melanoma cells. Degraded matrix imposes as black areas in the red fluorescent background. Green=Phalloidin, red=Alexa594-gelatine. Scale bars in microscopy pictures represent 20 μm. (B) Quantification of the matrix degradation in B16 F10 mouse melanoma cell lines. (n=200 per cell line). ImageJ was used as a software for quantification. Results are expressed as mean±s.e.m. Statistical analyses were standard two-tailed Student's t-test for two data sets using Prism (GraphPad Inc.). The P-values of <0.05 (*), <0.01 (**) and <0.001 (***) were deemed as significant, highly significant, and most significant, respectively.

