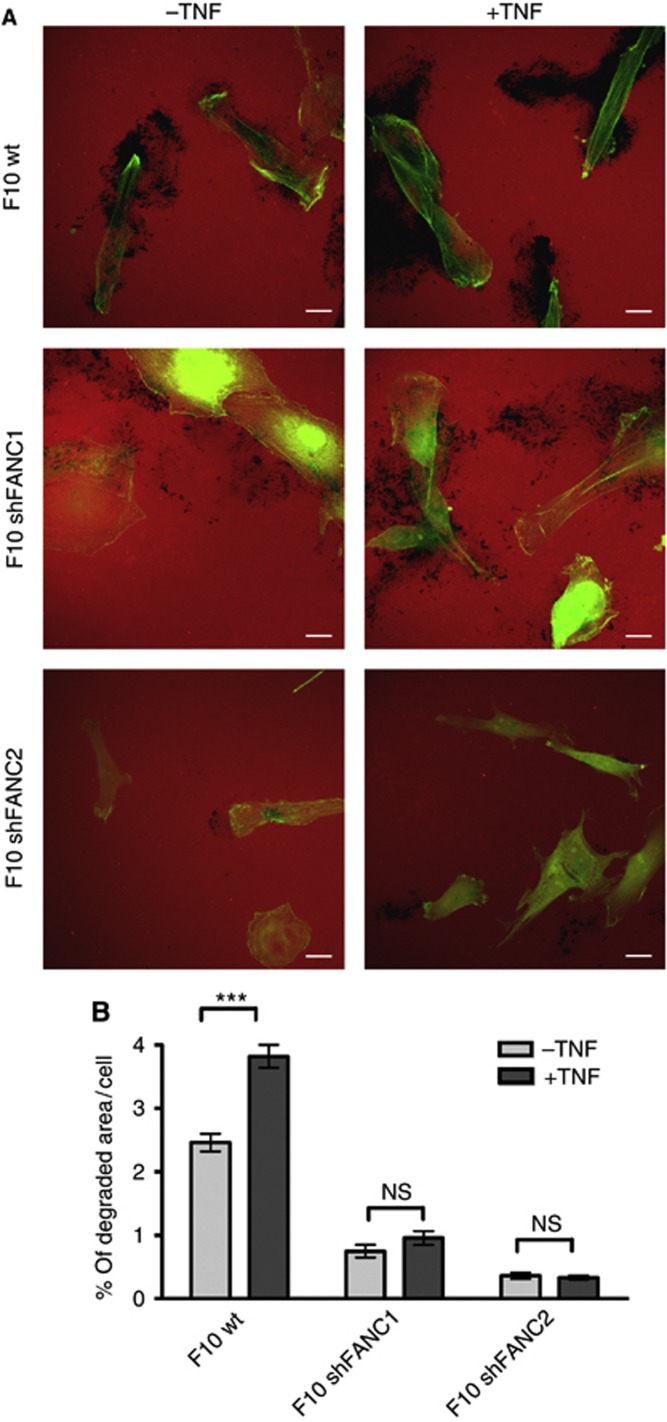
Figure 6.
Tumor necrosis factor (TNF)-induced matrix degradation is reduced in FAN-deficient B16 cells. (A) Degradation assay of B16 F10 mouse melanoma cells stimulated with TNF. Degraded matrix is visible as black areas in the red fluorescent background. Scale bars in microscopy images represent 20 μm. Green=Phalloidin. (B) Matrix degradation by B16 F10 mouse melanoma cell lines in the presence and absence of TNF was assessed by evaluating 200 cells per cell line; ImageJ was used as a software for quantification. Results are expressed as mean±s.e.m. Statistical analyses were standard two-tailed Student's t-test for two data sets using Prism (GraphPad Inc.). The P-values of <0.05 (*), <0.01 (**) and <0.001 (***) were deemed as significant, highly significant, and most significant, respectively.

