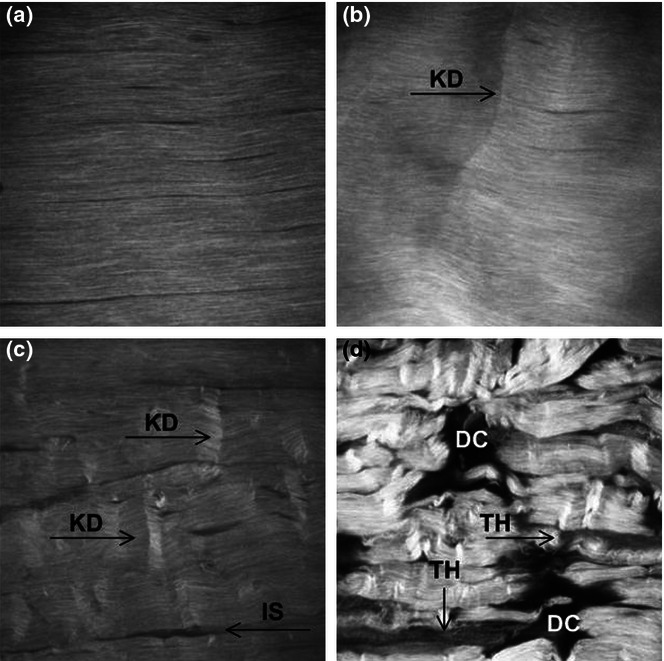
Figure 6.

Second harmonic generation imaging of the progression of fatigue damage during controlled in vivo loading. (A) Control tendons without fatigue, (B) Low fatigue demonstrating isolated kinked fibre deformations (KD), (C) Moderate fatigue showing increased kinking and widening of the interfibre space (IS), (D) High fatigue showing severe matrix disruption, poor fibre alignment, and greater widening of interface space. Regions of low signal intensity suggest fibre thinning (TH) and more severely, matrix discontinuities (DC). Field of view = 400 microns (Reprinted from Fung et al (2010), with permission from Elsevier).
