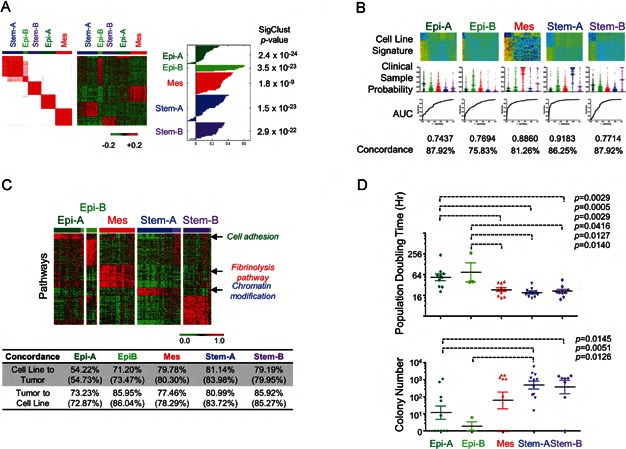
Figure 2. Identification of cell line subtype status.

- Five subtypes in ovarian cancer cell line classification. Left panel. CC matrix of 142 ovarian cell lines. Red = high; white = low similarity. Middle panel. Gene expression heatmap of ovarian cell lines. Red = high; green = low expression. Right panel. Silhouette analysis for each subtype. Column to the right of silhouette plot is the SigClust (Liu et al, 2008b) p-value indicative of cluster significance for each subtype.
- Prediction of clinical samples by cell line predictors using BinReg. Upper panel. Gene expression heatmaps for subtype predictors based on cell line expression data. Red = high; blue = low expression. Middle panel. Predicted probability of core clinical samples for cell-line subtype predictor by BinReg. Each subtype signature detected the probability difference between the corresponding subtype from the remaining subtypes with statistical significance (p < 0.0001; Mann–Whitney U-test). Lower panel. Receiver operating characteristic (ROC) analyses of subtype predictors. Overall accuracy is shown by the area under the ROC curve (AUC) (Pejovic et al, 2009). Concordance (%) of the subtype status derived from CC with the prediction based on the cell line subtype predictors.
- Upper panel. Cell line subtype-specific pathway enrichment. Subtype-specific single sample gene set enrichment analysis (ss-GSEA) scores (false discovery rate (FDR) of the significance analysis of microarrays (SAM) q = 0%, ROC > 0.85 as overexpressed gene sets) for 142 ovarian cell lines are shown as a heatmap. Red = high; green = low enrichment scores. Gene sets aligned in descending value of ROC; samples are aligned according to the subtype classification by CC and the SW. Deep colour = positive SW (core samples); pale colour = samples classified to a subtype, but negative SW. Arrows indicate positions of selected pathways. Lower panel: Concordance (%) of the subtype status (from CC by genes) with the prediction result (from BinReg based on the subtype predictors by enrichment scores). The number in parentheses indicates the accuracy of the prediction against core samples.
- Characterization of in vitro phenotypes of cell lines in each subtype. Upper panel. Population doubling time of a cell line was measured with the MTS assay (Matsumura et al, 2011) and is shown as dot plots. Lower panel. Anchorage-independent cell growth ability for each cell line was measured using the methylcellulose assay (Mori et al, 2009). Log10-transformed colony number is shown. p-values were computed by Mann–Whitney U-test. Abbreviations: Epi-A, epithelial-A; Epi-B, epithelial-B; Mes, mesenchymal; Stem-A, stem-like-A; Stem-B, stem-like-B.
