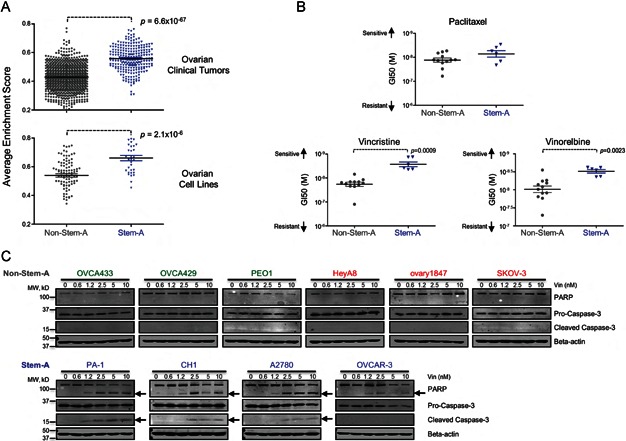
Figure 4. Susceptibility of Stem-A cells to microtubule assembly inhibitors.

- Estimated microtubule activity in non-Stem-A and Stem-A subgroups of ovarian cancer. Microtubule activity in 1142 core samples of ovarian clinical tumours (Top panel) and in 129 core samples of ovarian cell lines (Bottom panel) was estimated based on the average single sample gene set enrichment analysis (ss-GSEA) enrichment score of 19 microtubule-related gene sets (Supporting Information Table 16) acquired from GSEA databases (Supporting Information Table 6). Differences in microtubule activity between non-Stem-A and Stem-A subgroups were statistically evaluated with Mann–Whitney U-test in Graphpad Prism. Grey = non-Stem-A subgroup; blue = Stem-A subgroup.
- Specificity of drug sensitivity in ovarian cancer cell lines. A panel of 18 ovarian cancer cell lines was classified into non-Stem-A (OVCA433, OVCA429, OVCAR-8, PEO1, OVCA432, OVCA420, HeyA8, HEY, HeyC2, SKOV-3, ovary1847 and DOV 13) or Stem-A (PA-1, CH1, A2780, OVCAR-3, SKOV-4 and SKOV-6) groups and analysed for their sensitivity to paclitaxel (Top panel), vincristine (Left bottom panel) and vinorelbine (Right bottom panel). GI50 values were calculated with the results from cell proliferation assays for each cell type in three independent experiments, and the mean GI50s are shown as dot plots. A non-parametric Mann–Whitney U-test in Graphpad Prism was used to evaluate the results statistically. A higher value along the y-axis indicates increased sensitivity to the drugs. Colour as for (A).
- Detection of apoptotic activity upon vincristine treatment. Six non-Stem-A (Upper panel) and four Stem-A (Lower panel) cell lines were subjected to increasing concentrations of vincristine (0 to 10 nM) for 48 h. The presence of apoptotic activity was determined by immunoblotting for cleaved PARP and Caspase-3, as indicated by arrows. Abbreviations: Stem-A, stem-like-A.
