
Figure 2. Hα-syn progressively spreads from the MO to more rostral brain regions.
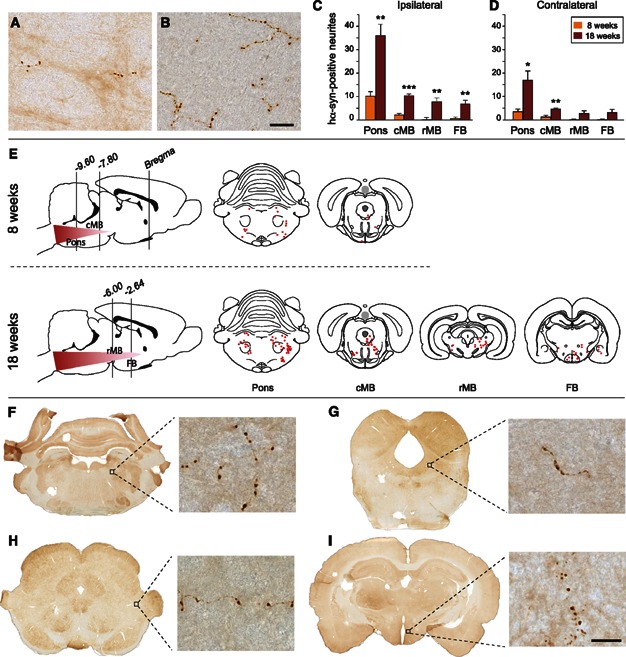
- A,B.Representative images of hα-syn-immunoreactive axons in tissue sections from the pons of high expressor rats sacrificed 8 (A) or 18 (B) weeks after vagal injection. Scale bar, 25 μm.
- C,D.The number of neuritic projections immunostained with an anti-hα-syn antibody was counted in the pons, caudal midbrain (cMB), rostral midbrain (rMB) and forebrain (FB) at 8 and 18 weeks post injection. Counts are from the side of the brain ipsilateral (C) and contralateral (D) to viral injection. Mean (n = 5/group) ± SEM. *P < 0.05, **P < 0.01, ***P < 0.001 by two-tailed t test.
- E.Topographical plot of the distribution and spreading of hα-syn-labeled neurites. Neuronal fibers from representative brain sections are shown as red dots. Bregma values indicate the caudo-rostral level.
- F–I.Representative tissue sections from the pons (F), caudal midbrain (G), rostral midbrain (H) and forebrain (I) of high expressor rats sacrificed at 18 weeks post vagal injection. Higher magnification images from the coeruleus-subcoeruleus complex (F), periacqueductal gray (G), peripeduncular nucleus (H) and hypothalamus (I) show axonal projections stained with an anti-hα-syn antibody. Scale bar (higher magnification panels), 25 μm.