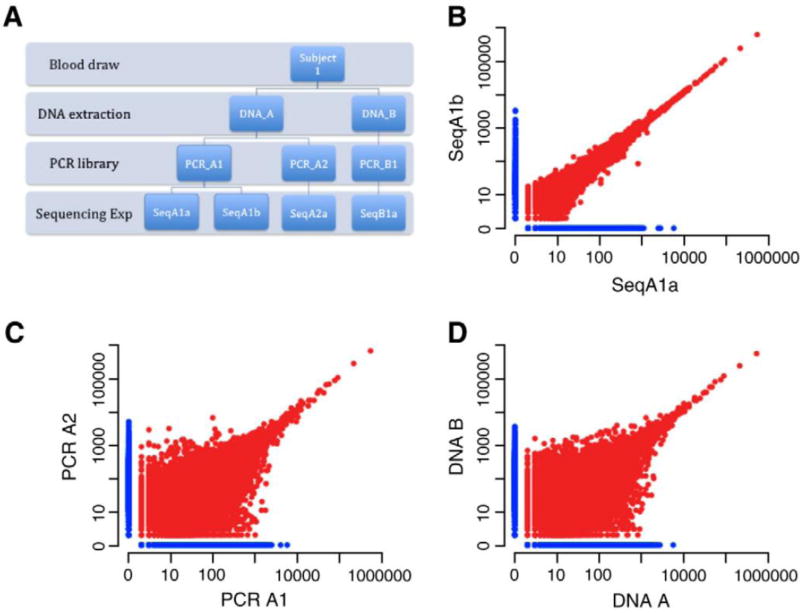
Figure 2. Experimental design and results of repeatability experiment.
A) Schematic of experimental design. B) Sequence copy counts of TCRB clones obtained by sequencing the same PCR library on two different lanes of a flow cell. Each point represents a unique clone in this log-log scatter plot. The points in red are found in both repetitions, while those in blue where only found in the one lane. The total number of overlapping clones plotted on this graph is 122,000, with 20,000 clones sequenced that were unique to each lane. C) Sequence copy counts obtained by sequencing two separate PCR reactions performed using template from the same DNA extraction. D) Sequence copy counts obtained by sequencing two different DNA extractions from the same blood draw.

