
Figure 4.
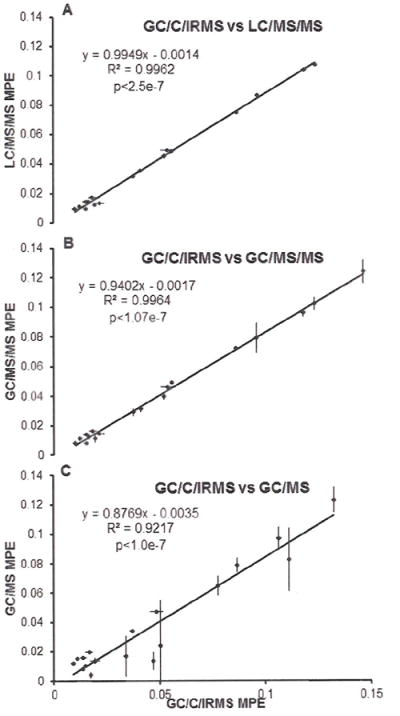
Comparison of 18 mixed muscle protein samples’ mean MPE between GC/C/IRMS and LC/MS/MS(A), GC/MS/MS(B) and GC/MS(C) respectively. Horizontal and vertical barsrepresent standard deviation of the GC/C/IRMS measurements and compared assay, respectively.