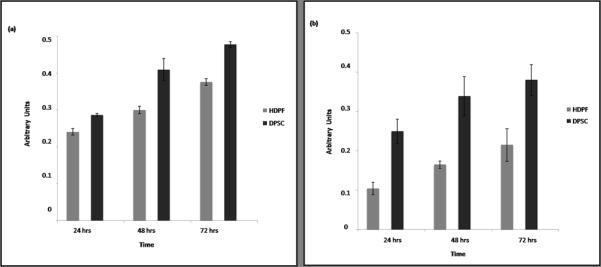
Figure 1.

Proliferation of HDPF and DPSC cells over time. Cells (DPSC or HDPF) were seeded in 96-well plates at 0.25×10⁴ cells/well and grown for indicated time periods. (A) For SRB assay, cells were fixed with TCA, stained and evaluated at 565 nm in a microplate reader. (B) For WST-1 assay, cells were incubated 1 hour in the pre-mixed solution of WST-1. Dye intensity was measured at 450 nm using a microplate reader. Data was analyzed from triplicate wells per experimental point and cell line, and reflect the results of 3 independent experiments.
