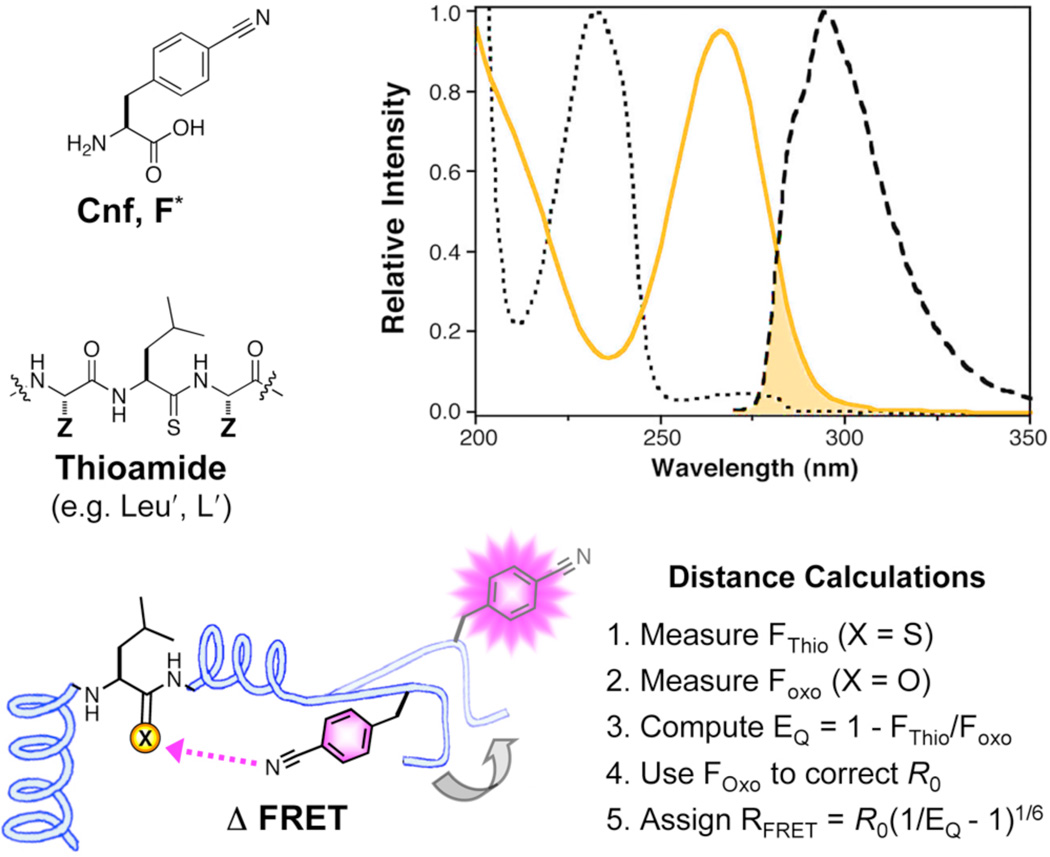
Figure 1.
Cyanophenylalanine/Thioamide FRET Interactions. Top Left: Cyanophenylalanine (Cnf, F*) and leucyl thioamide (Leu′, L′). Top Right: Normalized absorption (dotted black line) and fluorescence emission (dashed black line) spectrum of Cnf and absorption spectrum of Leu′Ala (yellow line). The shaded area indicates the spectral overlap that contributes to FRET. Bottom: Distance (RFRET) calculations are made using Förster theory as described in text.

