Figure 3.
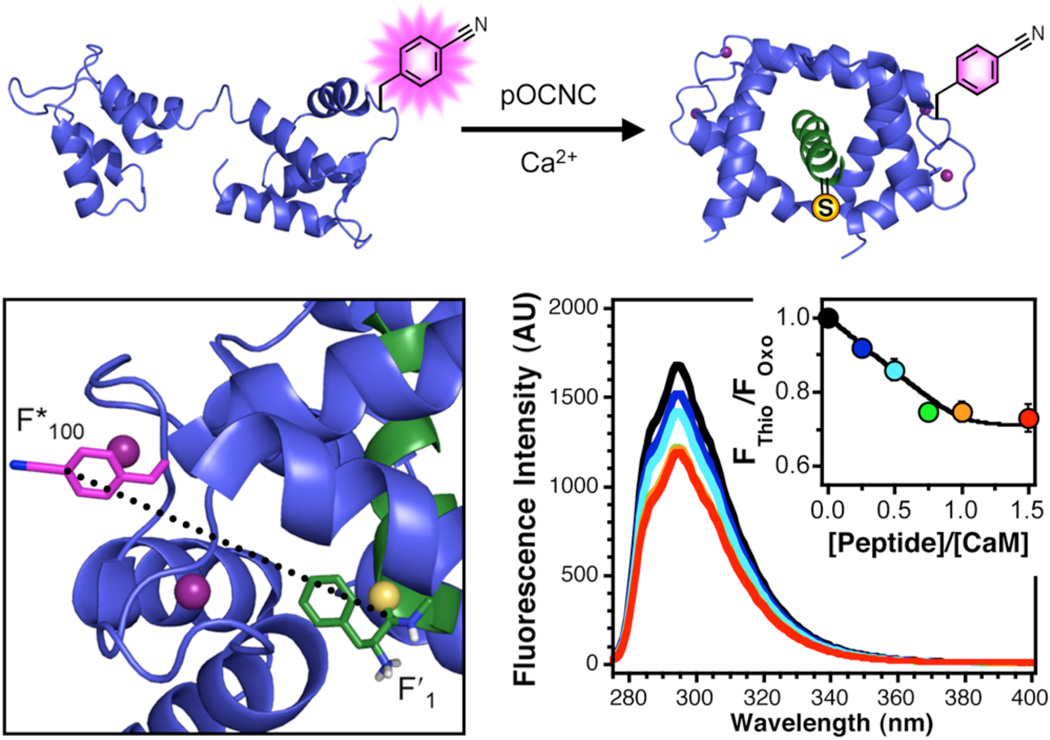
FRET in CaM/Peptide Complexes. Top: Binding of thioamide-labeled peptides (green) to Cnf-labeled CaM (blue) in the presence of Ca2+. Bottom Left: An image showing Cnf (pink) at position 100 in calmodulin (CaMFF*100) and thiophenylalanine (yellow sulfur atom) at position 1 in the pOCNC peptide (pOCNC-F′1). Ca2+ ions are shown as purple spheres. Adapted from PDB ID 1SYD using PyMol. The 18.9 Å separation shown represents an average of the separation of the center of the thioamide from the center of the ε-carbons of the Cnf ring. Bottom Right: Fluorescence emission spectra of solutions of 10 µM CaMFF*100 in the presence of increasing concentrations of pOCNC-F′1. Inset: Relative fluorescence of complexes of CaMFF*100/pOCNC-F′1 (FThio) to an oxoamide control CaMFF*100/pOCNC (FOxo). See Supporting Information for details.

