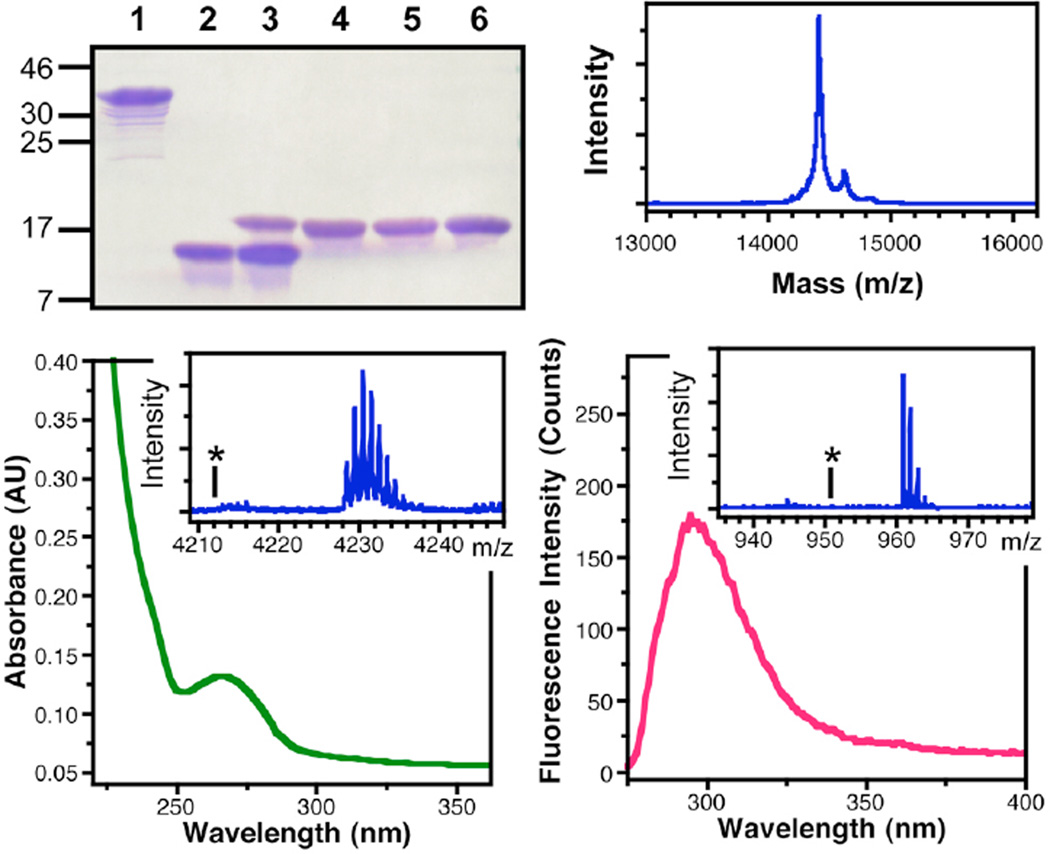
Figure 8.
Characterization of αSFF*39C123A′124 Ligation Product. Top Left: PAGE gel showing: αSF1–122F*39-Int before (1) and after thiolysis of the intein to generate αSF1–122F*39-SR thioester (2), ligation of αSF123–140C123A′124 to αSF1–122F*39-SR thioester (3), purified αSFF*39C123A′124 (4), αSFF*39C123 (5), and αSF (6). Top Right: MALDI MS analysis of full-length αSFF*39C123A′124. Bottom Left: UV/Vis absorption spectrum of αSFF*39C123A′124 showing thioamide absorption at 266 nm. Inset: MALDI MS analysis of trypsinized 103–140 fragment, confirming the presence of the thioamide at A′124; Calcd m/z (M+H): 4228.69, Obsvd: 4228.47. The asterisk indicates the absence of peaks corresponding an oxoamide at Ala124 in the 103–140 fragment; Calcd m/z (M+H): 4212.72. Bottom Right: Fluorescence emission spectrum of αSFF*39C123A′124 showing Cnf emission at 295 nm. Inset: MALDI MS analysis of trypsinized 35–43 fragment, confirming the presence of Cnf at position 39; Calcd m/z (M+H): 960.52, Obsvd: 960.77. The asterisk indicates the absence of peaks corresponding Tyr at position 39 in the 35–43 fragment; Calcd m/z (M+H): 951.51.

