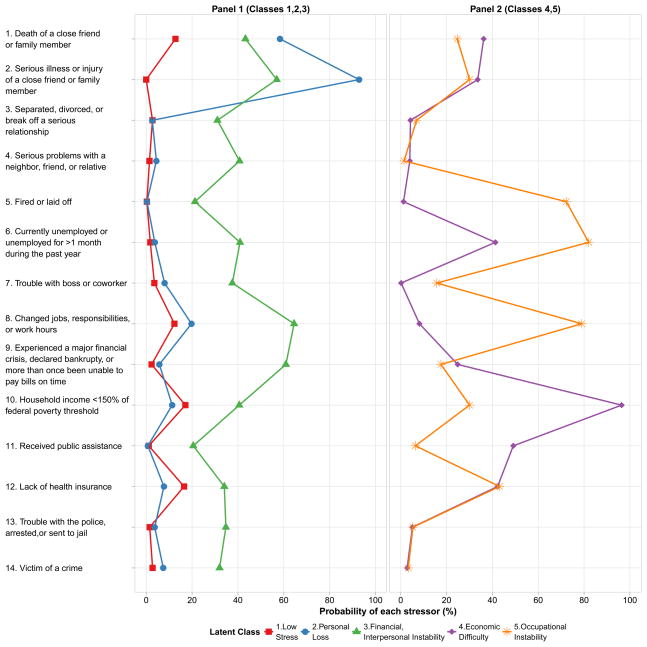
Figure 1.
Results of the latent class analysis (LCA) of 14 psychosocial and environmental problems.a
aEach line represents 1 of 5 latent classes of stress exposures. The figure shows the average probability of endorsing each stressors among participants in each latent class. The proportion of participants in each class is: 19.3% in class 1 (n=488); 25.2% in class 2 (n=636); 43.1% in class 3 (n=1,199); 8.8% in class 4 (n=304); and 3.7% in class 5 (n=99).

