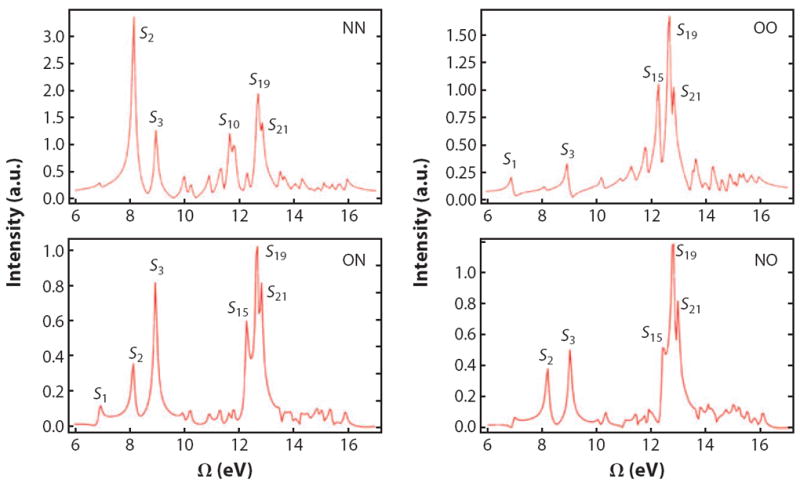
Figure 5.

Calculated stimulated X-ray Raman spectra of trans-NMA; both pulses are polarized parallel to the lab-frame V axis. We use Gaussian pulses, 128-as full width at half-maximum in intensity, with the center frequency set to either 401.7 eV (N1s) or 532.0 (O1s). Pulse sequences for the two-color signals (bottom row) are given from left to right in chronological order; i.e., in ON the O pulse come first and the N pulse comes second. Figure reprinted with permission from Reference 107. Copyright 2012.
