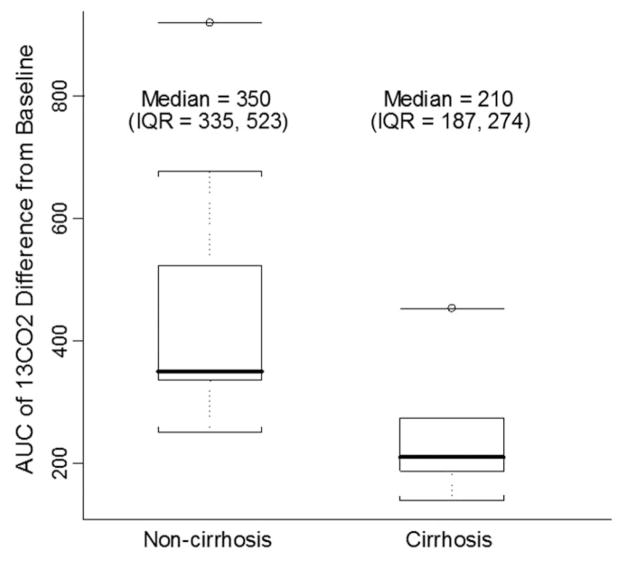
Figure 2.
Boxplots of [13C]-MBT results, comparing patients with (n = 5) and without (n = 9) cirrhosis on liver biopsy. The distribution is based on the 13CO2 AUC. The solid bar within the box represents the median value; upper boundary of the box: the 75th percentile; lower boundary of the box: the 25th percentile; and whiskers extend to the most extreme observation within 1.5 interquartile range units of the 25th and 75th percentiles. The median 13CO2 AUC was 210 for patients with cirrhosis and 350 for patients without cirrhosis (p = 0.04). p value was estimated by Wilcoxon tests.

