
Figure 2.
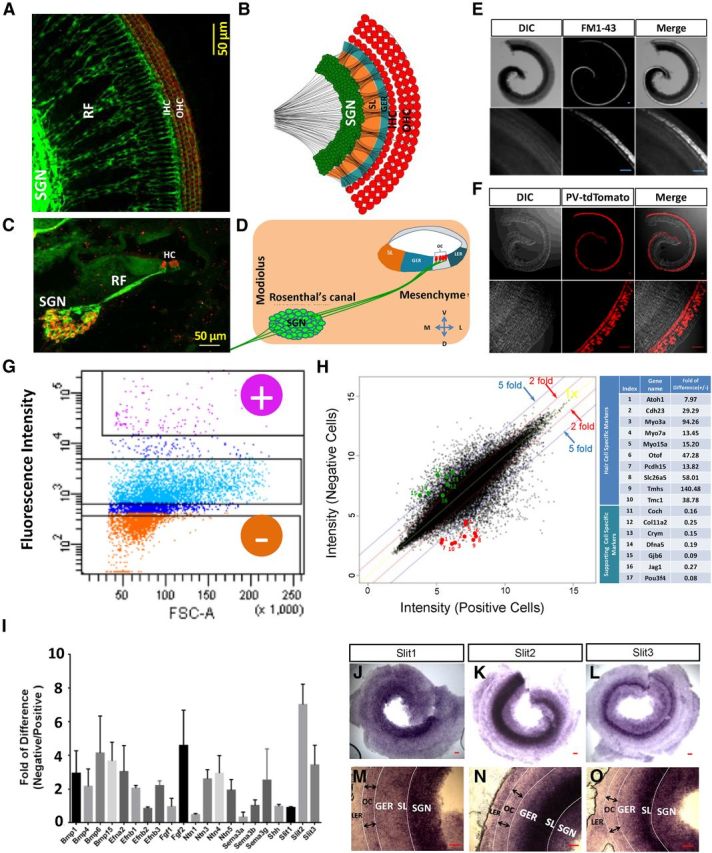
Gene expression analysis to identify Slit molecules as candidates to regulate the spatial patterning of SGNs. A–D, The SGN-HC innervation pattern at P1. A, B, Top view. C, D, Cross-section view. Green, TUJ1 staining; red, Myo6 staining in A and PV staining in C. B and D indicate that SGN somas are restricted in the Rosenthal's canal while their peripheral axons penetrate through the otic mesenchyme and GER to innervate HCs (red) in the organ of Corti (OC). LER, Lesser epithelial ridge (or outer sulcus). E, Differential interference contrast (DIC) and fluorescence images of a wild-type cochlea at P6 stained with the styryl dye FM1-43. Top, Whole cochlea. Bottom, Higher-magnification images. Scale bar: 50 μm. F, Images of a cochlea of a PV-Cre; Ai14 mouse at P6. Scale bar, 50 μm. G, Gating configuration of FACS for separating HCs (fluorescence-positive population as marked by “+”) from other cochlear cells (negative population as marked by “−”) based on fluorescence intensity. H, Plot of the expression value of individual probes in the negative cell population versus positive cell population. Fold difference of 1×, 2×, and 5× is marked by the yellow, red, and blue line respectively. Selected HC-specific genes (1–10 in the table) and supporting cell-specific genes (11–17 in the table) are highlighted by the red and green circles respectively. I, Fold of difference between the negative and positive cell populations for selected axon guidance molecules and morphogens in the microarray analysis. N = 3. Bar = SD. J–O, In situ hybridization of Slit1 (J, M), Slit2 (K, N), and Slit3 (L, O) molecules in the whole-mount cochlea at E16. M–O are higher-magnification images of J–L respectively. Scale bar, 50 μm.