
Figure 3.
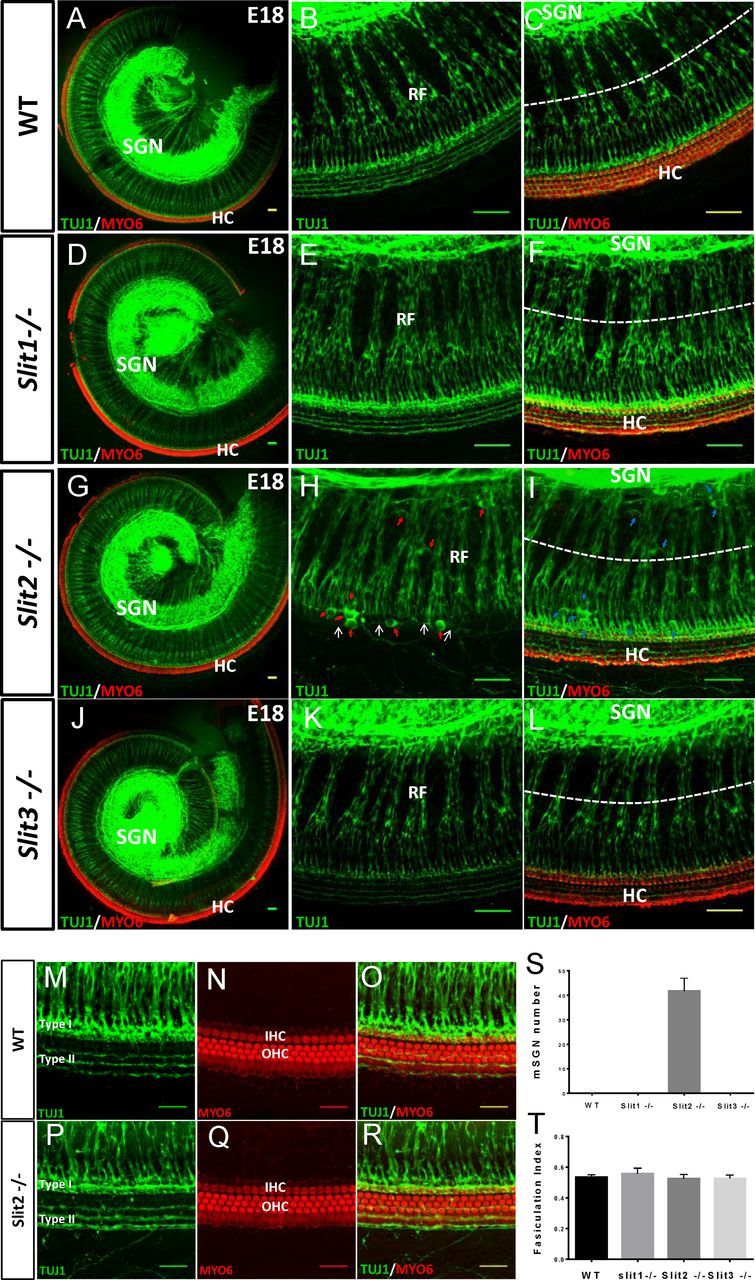
Mispositioned SGNs in the Slit2 mutant cochlea at E18. A–L, Representative images of SGN (green, TUJ1 staining) innervation of HCs (red, Myo6 staining) in the whole-mount cochlea of wild-type, Slit1−/−, Slit2−/−, and Slit3−/− embryos, as labeled. Images in middle and right panels are higher-magnification images, representing TUJ1 staining and superimposed TUJ1 and Myo6 staining respectively. Note that H is the projection of a subset of z-stack images, not including HC layers to show more clearly the mispositioned SGNs (mSGNs), while the other images are the projections of the complete z-stack images. Red and blue arrows (in H and I respectively) point to the mSGNs in the Slit2−/− cochlea, and white arrows (in H) point to the misrouted neurites originated from the mSGNs. Scale bar, 50 μm. Enlarged images were taken with a 40× oil objective (numerical aperture 1.30). M–O, Example images of SGN fibers (green) and HCs (red) and their superimposed image of a wild-type cochlea. P–R, example images of a Slit2−/− cochlea. Scale bar, 25 μm. S, Average number of mSGNs per cochlea for wild-type and different Slit mutant mice. Bar = SD. N = 6 embryos for all genotypes. T, Average fasciculation index (quantified as the ratio of the total thickness of RF bundles over the total width along the white dotted line shown in C, F, I, and L. Bar = SD. N = 6 embryos for all genotypes.