Figure 6.
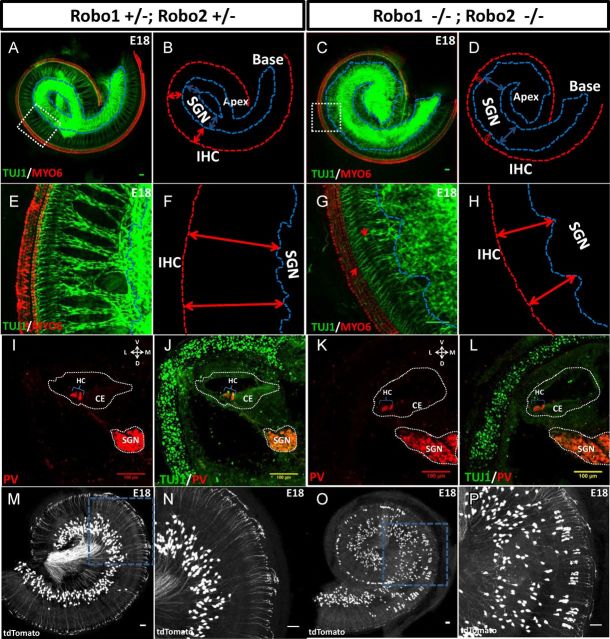
Expansion of SG territory in the Robo1/2 mutant. A–H, Representative images of the whole-mount cochleae from Robo1+/−; Robo2+/− and Robo1−/−; Robo2−/− embryos at E18. The red lines with double arrowheads illustrate the distance between the lateral SGN boundary and inner HCs (SGN–IHC distance). The blue lines and double arrowheads illustrate the SGN boundary and its width respectively. E–H, High-magnification images of A–D. Scale bar, 50 μm. I–L, Representative images of cross sections of cochleae from Robo1+/−; Robo2+/− (I, J) and Robo1−/−; Robo2−/− (K, L) embryos at E16. White dotted curves mark the boundaries of the SG (SGN) and cochlear epithelium (CE). M–P, Representative whole-mount images and their enlarged view (right) of sparsely labeled SGNs (by tdTomato expression) distributed in E18 cochleae from Robo1+/−; Robo2+/− (M, N) and Robo1−/−; Robo2−/− (O, P) mice, which carried Neurogenin1-CreERT2 and Ai14 alleles. Scale bar, 50 μm.

