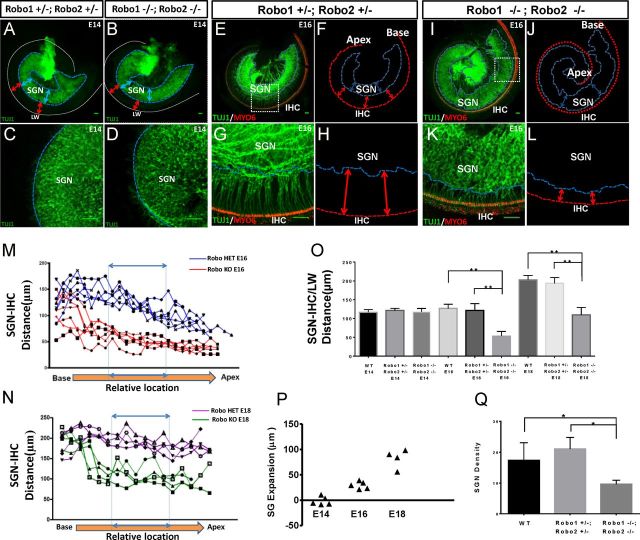
Figure 7.
SG territory progressively expands toward the cochlear epithelium in the Robo1/2 mutant. A–L, Representative images of cochleae from Robo1+/−; Robo2+/− and Robo1−/−; Robo2−/− embryos at E14 (A–D) and E16 (E–L) respectively. Labels are applied in a similar way as in Figure 6. Scale bar, 50 μm. M, N, Plot of SGN–IHC distance along the base–apex axis of the cochlea for selected Robo1−/−; Robo2−/− mutants (M, red; N, green) and their Robo1+/−; Robo2+/− littermates (M, blue; N, purple) at E16 (M) and E18 (N). O, Average SGN–LW distance (at E14) or SGN–IHC distance (at E16 and E18) in the middle part of the cochlea for Robo1/2 mutants, and their heterozygous and wild-type littermates. N = 5 embryos for all genotypes at E14 and E16, N = 4 for all genotypes at E18. Bar = SD. **p < 0.01, one-way ANOVA with Tukey's multiple-comparisons test. P, Quantification of SG expansion in the Robo1/2 double mutant at different developmental stages (see Materials and Methods for details). Each triangle represents the average expansion distance for a single mutant cochlea as normalized to the wild-type tissue. Q, Average SGN density as quantified by the number of SGNs per 10,000 μm2 in wild-type and Robo mutant embryos at E18. N = 4 embryos for all genotypes. Bar = SD. *p < 0.05, one-way ANOVA with Tukey's multiple-comparison test.

