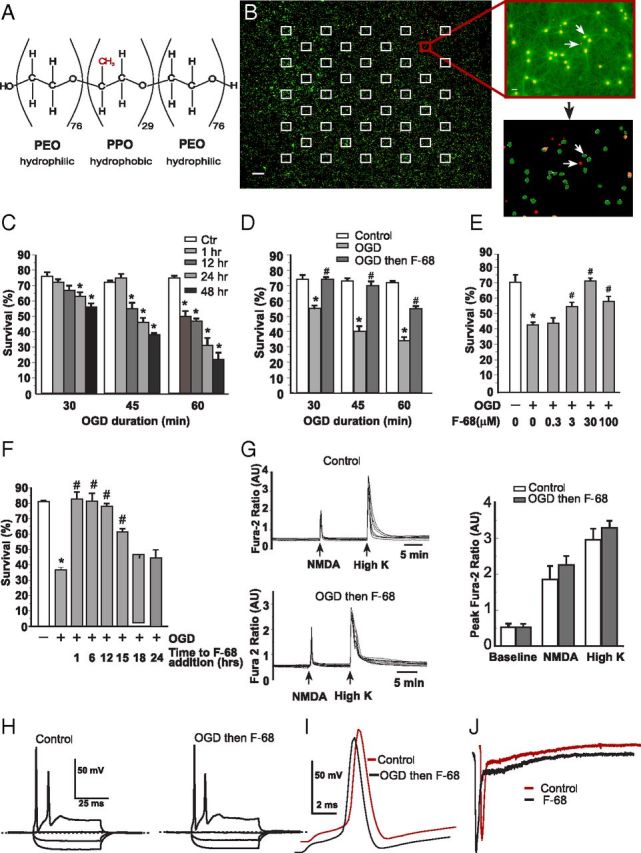
Figure 1.

F-68 rescues hippocampal neurons from OGD insult. A, Structure of the tri-block copolymer F-68. B, Left, Pseudocolored photomontage of contiguous 20× fields obtained by high-content imaging of cultured hippocampal neurons over an entire 15-mm-diameter coverslip. Images are overlays of calcein (green) and DRAQ5 (red) images. Squares indicate the location of the 42 fields on the coverslip used for automated cell counting. Scale bar, 500 μm. Top right, Overlaid calcein and DRAQ5 images from the indicated site in the montage. Scale bar, 10 μm. Bottom right, Result of automated image segmentation performed on the image above. Arrows show identified dead (red) and living (green) cells. C–F, Each experimental unit (n) consists of six coverslips per condition, with high-throughput imaging counting ∼1300 cells per coverslip. * indicates significantly different from control (Ctrl); # indicates significantly different from OGD. C, Changes in mean ± SD neuronal survival over time after 30, 45, and 60 min of OGD. n = 3 per condition. D, Changes in mean ± SD percentage neuronal survival induced by F-68 treatment as a function of OGD duration, measured 48 h after OGD (n = 3 per condition per OGD duration). E, Concentration dependence of F-68-induced rescue of neurons after 45 min OGD, measured 48 h later (n = 3 per condition). F, Changes in mean ± SD percentage neuronal survival with increasing delay in F-68 addition after OGD, measured 48 h after OGD (n = 3 per condition). Neuronal rescue from OGD persists when F-68 addition is delayed as much as 12–15 h after OGD. G, Raw, time-dependent [Ca2+]i changes in response to NMDA or potassium-induced membrane depolarization in control neurons (top left) and in neurons 5 d after rescue from 45 min OGD with F-68 (30 μm; bottom right). Right, Mean ± SD peak fura-2 ratios obtained in each condition (n = 3, each study of at least 5 neurons). H, Voltage responses to current injection are similar between control neurons and neurons, 5 d after rescue from OGD-induced death with F-68 (30 μm). I, Action potential morphology is identical between control (orange) neurons and neurons 5 d after rescue from OGD with F-68 (30 μm; black). Traces are offset for clarity. J, Representative NMDA-activated currents in hippocampal neurons studied before (orange) and after 3 min exposure to F-68 (30 μm; black). Mean ± SD current densities were −24.3 ± 2 pA/pF before and −21.4 ± 2 pA/pF after exposure of nine cells to F-68 (30 μm). Mean ± SD times to recovery to half-maximal amplitude were 246 ± 9.5 and 246 ± 8 ms, respectively.
