Figure 2.

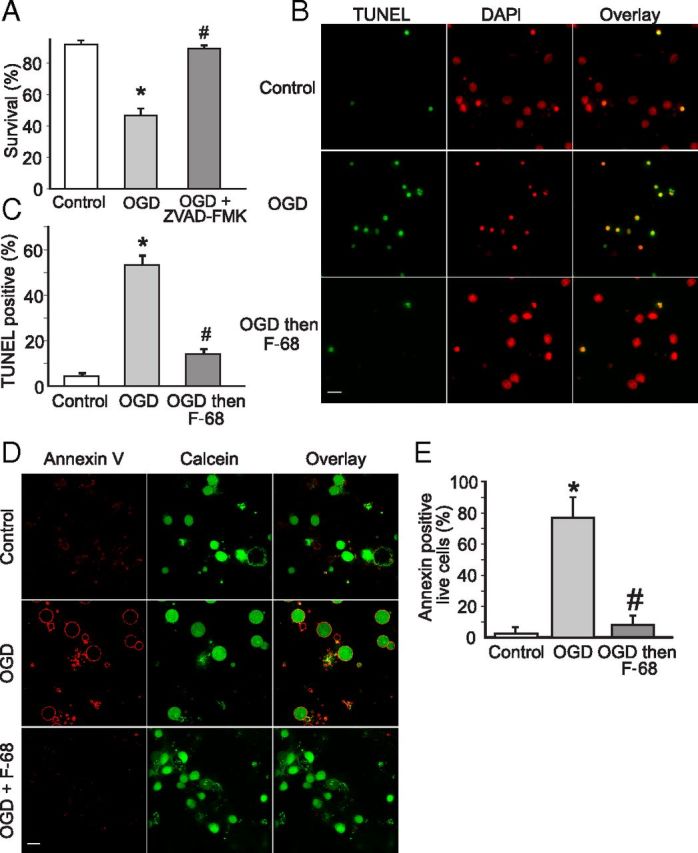
F-68 prevents OGD-induced apoptosis. A, C, Each experimental unit (n) consists of six coverslips per condition, with high-throughput imaging counting ∼1300 cells per coverslip. * indicates significantly different from control; # indicates significantly different from OGD. A, Mean ± SD percentage neuronal survival, 48 h after OGD (45 min) or control, the former in the presence and absence of Z-VAD-FMK (50 μm; n = 3 per condition). B, Photomontage of representative micrographs of neurons labeled with TUNEL (green) for apoptotic neurons and DAPI (red) for all cells. Images obtained 48 h after 45 min of exposure to control or OGD buffers with and without immediate treatment thereafter with F-68 (30 μm). Scale bar, 10 μm. C, Mean ± SD percentage of TUNEL-positive neurons, 48 h after exposure to control buffer, or 45 min OGD with and without immediate treatment thereafter with F-68 (30 μm; n = 3). D, Photomontage of Annexin V labeling (red) of viable neurons (green), obtained 6 h after 45 min exposure to control buffer or OGD buffers with and without immediate treatment thereafter with F-68 (30 μm). Scale bar, 10 μm. E, Mean ± SD percentage of Annexin V-positive neurons by condition (n = 5; for each study, 12 randomly selected fields of 5–10 neurons each, counted on each of 2 coverslips per condition).
