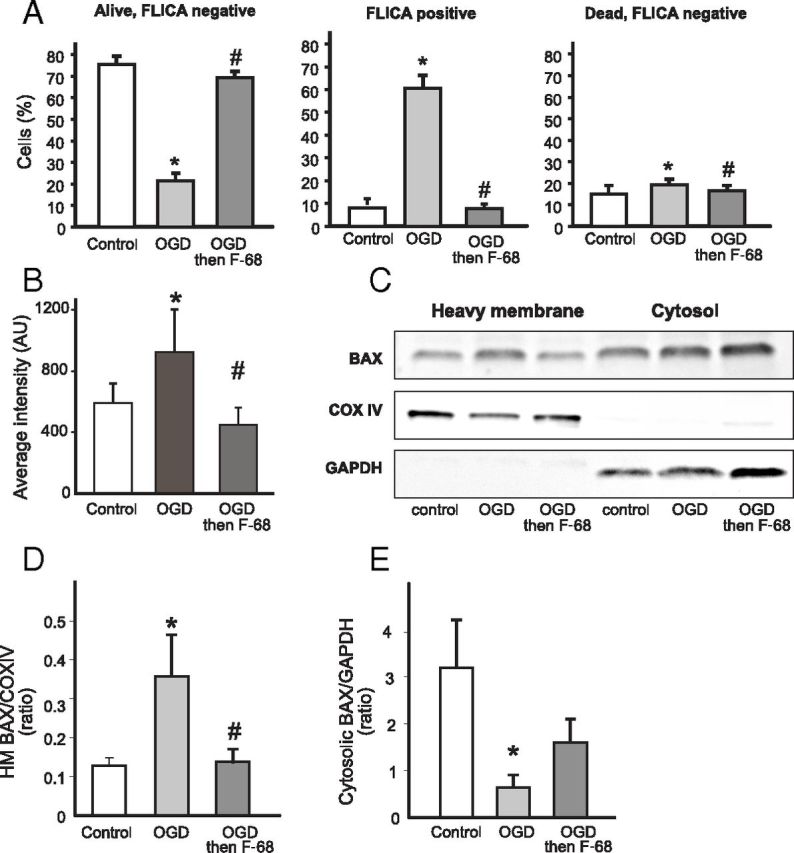
Figure 6.

F-68-induced inhibition of apoptosis persists when F-68 treatment is delayed for 12 h after OGD. F-68 (30 μm) or media control were administered 12 h after OGD (45 min), and measurements were made 12 h after F-68 administration. A, Mean ± SD percentage of live/dead and FLICA-positive/negative neurons. Each experimental unit (n) consists of six coverslips per condition, with high-throughput imaging counting ∼1300 cells per coverslip (n = 3). B, Mean ± SD intensity of cytochrome c immunoreactivity over the nuclear volume; n = 6 coverslips per condition. C, Representative Western blots of BAX immunoreactivity in heavy membrane and cytosolic fractions of neurons treated with F-68. Blots were stripped and blotted with the mitochondrial marker COX IV and the cytosolic marker GAPDH to identify fractions and normalize intensities for protein loading. D, E, Quantification of BAX immunoreactivity in heavy membrane (D) and cytosolic (E) fractions. Data are expressed as means ± SD of ratios of BAX/COX IV or BAX/GAPDH (n = 3 experiments, each experiment using 4 × 10⁶ cells per condition). * indicates significantly different from control; # indicates significantly different from OGD.
