Figure 4.

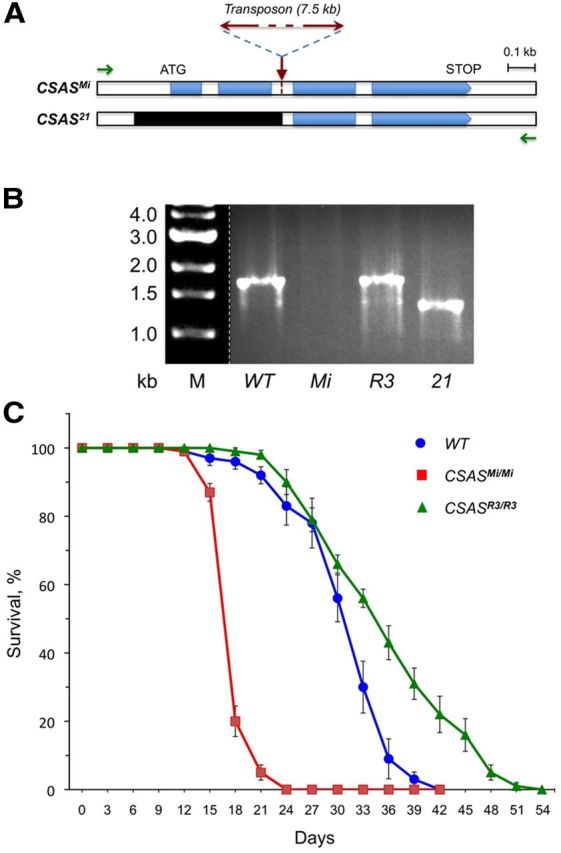
Schematic of CSAS mutants, their molecular analysis, and longevity phenotypes. A, CSAS gene region of CSASMi mutants with indicated position of the Minos transposon insertion. B, Corresponding genomic region of CSAS21 mutants with indicated deletion (black). Green arrows indicate the position of primers that were used for genomic PCR analysis of the mutants. B, Genomic PCR analysis of CSAS genotypes homozygous for wild-type (WT), Mi, R3, and 21 alleles, as indicated. The genomic PCR amplification of the region shown in A generates a 1.7 kb band for wild-type and R3 (revertant) alleles. A ∼1.3 kb PCR band is generated for CSAS21 mutants having a 431 bp deletion, while no PCR amplification occurs for CSASMi mutants due to the large transposon insertion. C, CSAS mutants have significantly decreased longevity. Survival curves for wild type (WT), CSASMi mutants, and CSASR3 revertants. At least 100 flies were analyzed for each genotype. The CSASMi allele was outcrossed 10 times to wild-type flies to minimize potential influence of genetic background. Error bars represent SEM.
