
Figure 3.
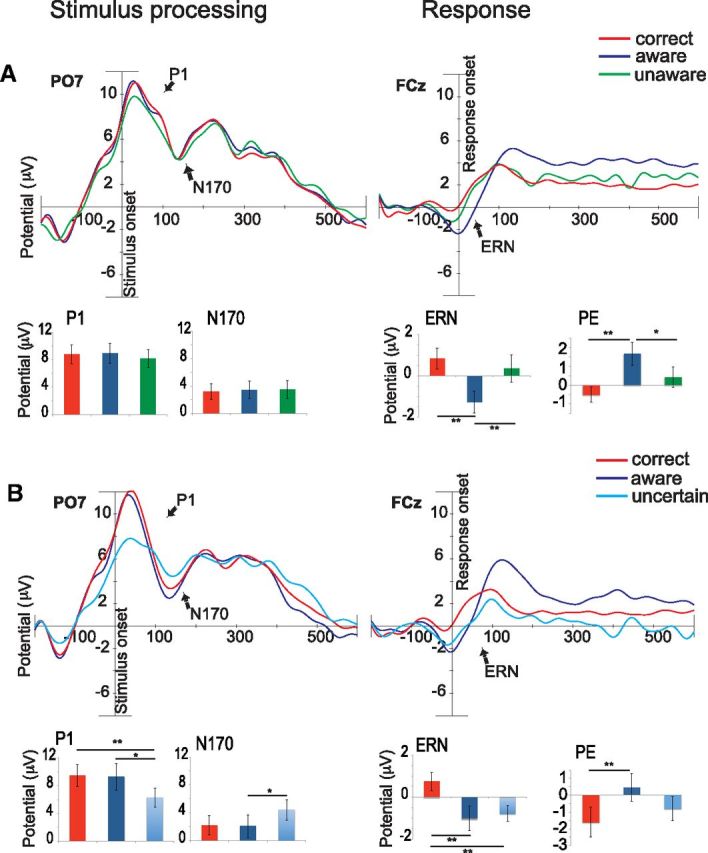
Stimulus-locked grand averages in channel P07 (left) and response-locked grand averages in channel FCz (right). The bar graphs show ERP amplitudes for the average of the P1 and N170 effect (PO7, O1, O2, and PO8), the ERN effect (Fz, FCz, and Cz), and the Pe effect (FC1, FCz, FC2, C1, Cz, C2, CP1, CPz, and CP2). Aware errors are depicted in dark blue, unaware errors in green, uncertain responses in light blue, and correct responses in red. A, ERP grand average and amplitudes in the group of subjects who had enough unaware errors (n = 13). B, ERP grand average and amplitude in the group of subjects who had enough uncertain responses (n = 11). The bar graphs reveal smaller P1 and N170 amplitudes for perceptually uncertain responses (lower left graphs) compared with the other conditions, and higher ERN amplitudes for aware (upper and lower right graph) and uncertain responses (lower right graph) compared with the other conditions. Significant differences are indicated by asterisks (*p < 0.05, **p < 0.01).