
Figure 5.
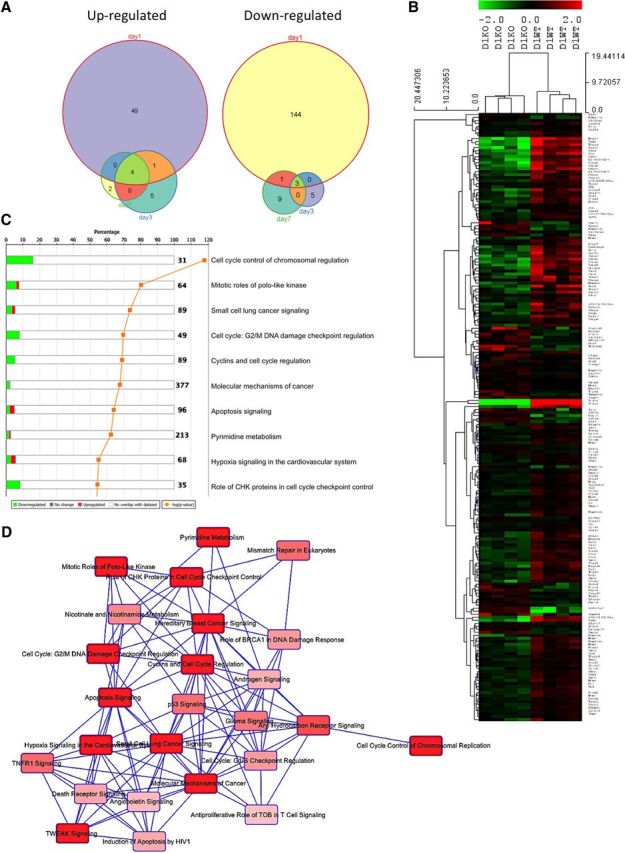
Cell cycle genes are upregulated in the spinal cord of trkB.T1+/+ mice early after SCI but not in trkB.T1-null mice. A, Differential gene expression analysis in the spinal cord over time comparing differentially expressed genes in the trkB.T1−/− mice compared with WT mice demonstrates that the largest number of genes is altered early at day 1 after SCI. The Venn diagrams show each time point (days 1, 3, and 7 after SCI), with the number of differentially expressed genes at each. B, Heat map of genes that cluster by genotype at day 1 in the trkB.T1−/− spinal cord compared with WT. The normalized expression of the summarized probe sets is shown. The histogram key indicates that green genes are downregulated and red genes are upregulated. C, Unbiased pathway analysis demonstrates significant downregulation of cell cycle pathways in trkB.T1−/− spinal cord compared with WT at day 1. The top 10 differentially enriched canonical signaling pathways are shown. Green indicates downregulation and red indicates upregulation. The orange line shows the −log10 p for each pathway. D, Overlapping, shared gene set analysis was performed to determine whether there are shared genes across a number of significantly regulated canonical signaling pathways. Each pathway is displayed as a single node. The darker the red, the more significant the overlapping pathway is in our gene set by the Fisher's exact test p-value. This diagram depicts the top 25 significantly regulated pathways in which our gene set has shared genes across pathways.