
Figure 7.
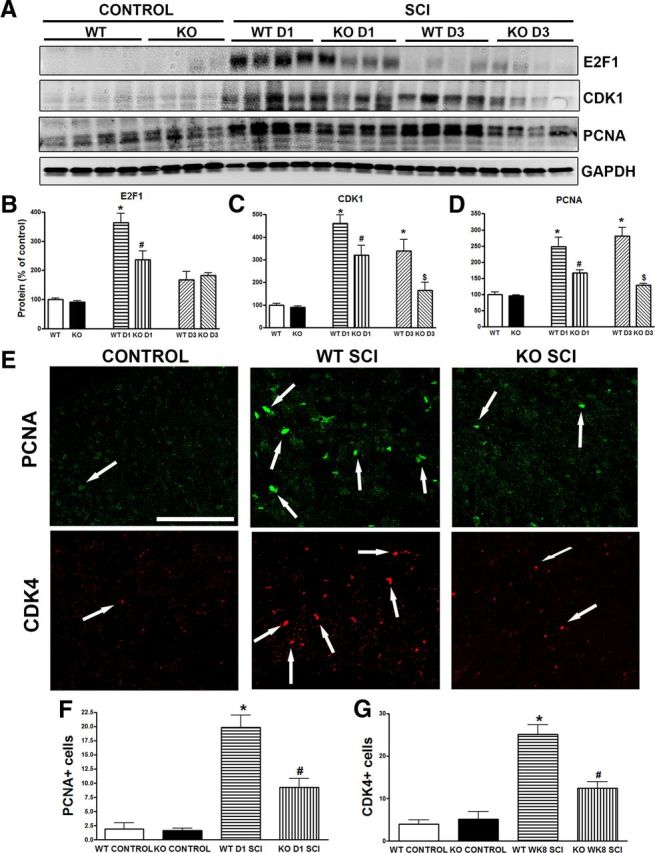
Deleting trkB.T1 attenuates upregulation of cell-cycle-related proteins in the lumbar SDH after SCI. A–D, Western blot analysis showing that 1 d after SCI, expression levels of E2F1, CDK1, and PCNA in the lumbar SDH were markedly increased in the trkB.T1+/+ mice, but significantly lower in trkB.T1−/− mice. Elevation of E2F1 was transit only at 24 h after SCI, but at 3 d after injury, the expression of CDK1 and PCNA remained higher in the trkB.T1+/+ mice than that in the trkB.T1−/− mice (n = 4 mice per group). *p < 0.05, WT D1/D3 SCI versus WT control; #p < 0.05, KO D1 SCI versus WT D1 SCI; and $p < 0.05, KO D3 SCI versus WT D3 SCI. E, Representative coronal sections of lumbar spinal cord stained for PCNA and CDK4. F, Few PCNA+ cells were found in the SDH of control mice. PCNA+ cells increased in trkB.T1+/+ (n = 6) and trkB.T1−/− mice (n = 6) 1 d after SCI compared with controls (n = 4), which was significantly attenuated in trkB.T1−/− compared with trkB.T1+/+ mice. G, Few CDK4+ cells were found in the SDH of control mice. CDK4+ cells increased in trkB.T1+/+ (n = 7) and trkB.T1−/− mice (n = 7) 8 weeks after SCI compared with controls (n = 4), which was significantly attenuated in trkB.T1−/− compared with trkB.T1+/+ mice. Scale bar, 100 μm. The data in B–D and F–G were analyzed by one-way ANOVA with post hoc analysis using Student–Newman–Keuls test. *p < 0.05, WT SCI versus WT control; #p < 0.05, KO SCI versus WT SCI. Data are expressed as mean ± SEM.