
Figure 10.
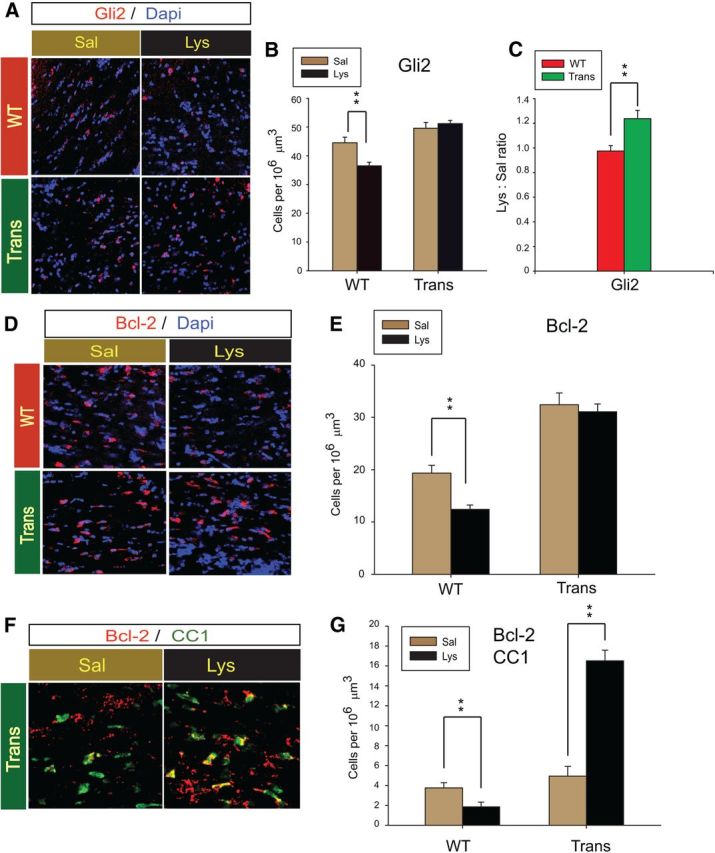
Maintenance of Gli2-expressing cells at 3 DPL is associated with Bcl2-mediated OL survival in the CNP-Sox17 mouse. A, Confocal microscope images of Gli2+ cells (red) in the lesion area at 3 DPL. B, Quantitative analysis of Gli2+ cells at 3 DPL. No change is observed in Trans. Values are means ± SEM of three experiments. **p < 0.01 versus saline, paired Student's t test. C, Plot of lysolecithin/saline (Lys:Sal) ratios for WT and Trans shows increased density of Gli2+ cells after lysolecithin injection. **p < 0.01 versus WT, unpaired Student's t test. D, Confocal microscope images of Bcl-2+ cells (red) at 3 DPL. E, Quantitative analysis of total Bcl-2+ cells at 3 DPL. No change is observed in Trans. Values are mean ± SEM of three experiments. **p < 0.01 versus saline, paired Student's t test. F, Confocal images of Bcl-2+ (red) and CC1+ (green) cells at 3 DPL. Double-positive cells appear yellow. G, Quantitative analysis of Bcl-2-expressing CC1 cells at 3 DPL. **p < 0.01 versus saline, paired Student's t test. All cell counts are mean and SEM using mice obtained from four independent litters.