Figure 2.
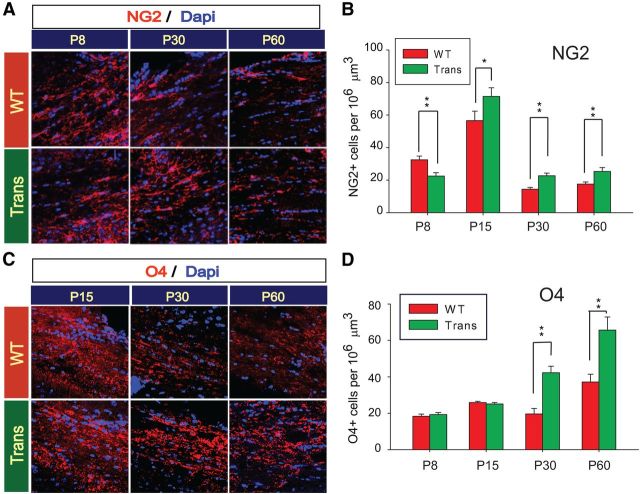
Developmental analysis of OL lineage cells in the postnatal CNP-Sox17 transgenic mouse. A, Confocal images of NG2+ progenitor cells (red) in corpus callosum of WT and CNP-Sox17 transgenic (Trans) mouse strains. Nuclei are counterstained with DAPI (blue). B, Quantitative analysis of cells positive for NG2+. The density of NG2+ cells is plotted as a function of postnatal age. Trans WM first show decreased density at P8 followed by increases through P60. C, Confocal images of O4+ pre-OL cells (red) in cingulate WM of WT and CNP-Sox17 transgenic (Trans) mouse strains. Nuclei are counterstained with DAPI (blue). D, Quantitative analysis of cells positive for O4+. The density of O4+ cells is plotted as a function of postnatal age. Trans WM shows increases starting at P30. Mean and SEM were obtained with mice from at least three independent litters. *p < 0.05, **p < 0.01 versus WT, unpaired Student's t test.

