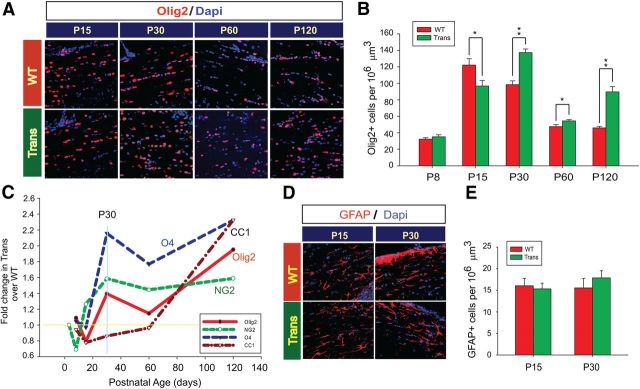
Figure 4.
Overexpression of Sox17 modulates the oligodendroglial lineage and not GFAP+ astrocytes. A, Confocal images of Olig2+ cells (red) in corpus callosum. B, Quantitative analysis of Olig2+ cells in corpus callosum. The density of Olig2+ cells is plotted as a function of postnatal age, indicating increased oligodendroglial commitment in Trans beginning at P30. Values represent means ± SEM. *p < 0.05, **p < 0.01 versus WT (unpaired Student's t test). C, Summary of postnatal changes, from P8 through P120, in oligodendroglial lineage cells in the CNP-Sox17 WM illustrated as a line plot. The horizontal line at 1 represents WT levels. At P30, the large increase in Olig2+ cells likely consists primarily of NG2+ and O4+ cells. D, Confocal images of GFAP+ astrocyte cells (red) in corpus callosum. E, Quantitative analysis of GFAP+ cells in corpus callosum. The density of astrocytes is plotted as a function of postnatal age, indicating no significant effect of Sox17 overexpression on astrocyte development. Values represent mean and SEM of all cell counts (B, E) using mice obtained from at least four independent litters.

