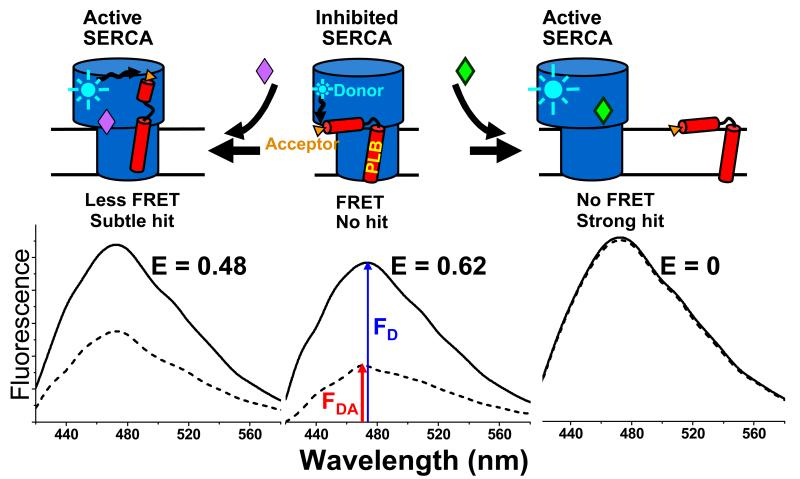
Figure 1. FRET assay for disruption of the inhibitory SERCA-PLB interaction.
Top: schematic diagram illustrating possible effects of compounds on the SERCA-PLB complex. Bottom: fluorescence intensity spectra that would result (solid curve is donor-only control, FD, dashed curve is donor-acceptor complex, FDA). FRET efficiency is given by E = 1 − FDA/FD. Center: Most compounds have no effect, so the SERCA-bound donor remains quenched by FRET to the PLB-bound acceptor, giving high E value (no hit). Right: a compound that completely dissociates the complex would completely eliminate FRET, giving E = 0 (strong hit). Left: a compound that causes a structural rearrangement within the SERCA-PLB complex would cause a more subtle change in FRET.

