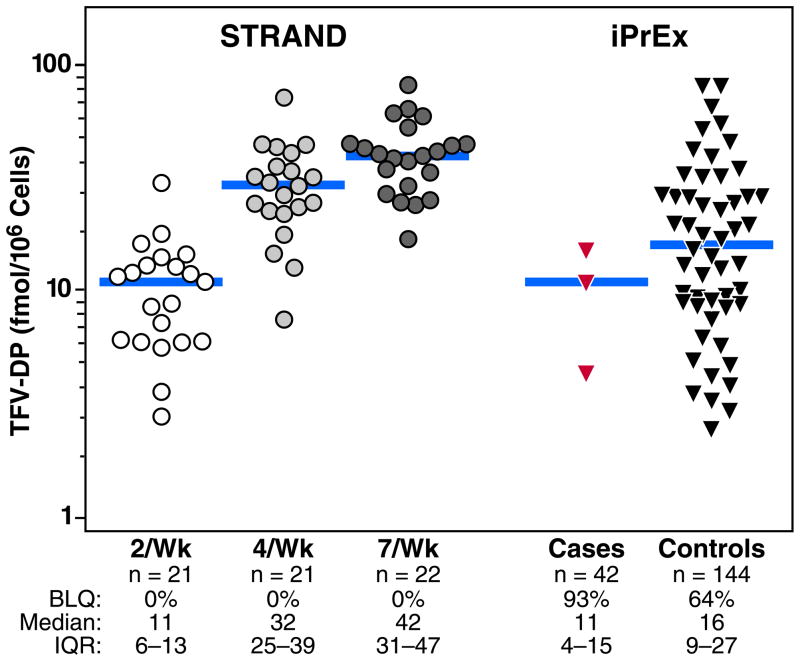
Fig 1.
Observed TFV-DP concentrations from STRAND and iPrEx. The values observed in the STRAND study are shown on the left for 2 doses/week (open circles), 4 doses/week (light-toned circles), and 7 doses/week (dark-toned circles). iPrEx values on the right included those from the visit with first evidence of HIV infection in cases (red triangles) and the matched study visit in HIV-negative controls (dark-toned triangles). The bars represent the medians. The numbers of participants tested, the proportion of vPBMC tested with detectable TFV-DP; the median concentrations among values in the detectable range; and the interquartile ranges are listed below the x-axis.

