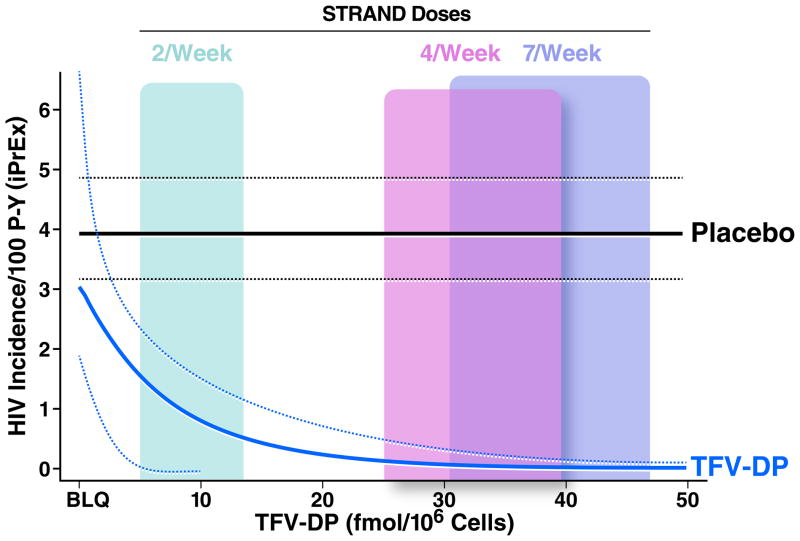
Fig. 3.
Estimated HIV incidence from exponential regression model of TFV-DP concentrations (fmol/M vPBMC) in iPrEx. The placebo HIV infection rate is shown as a horizontal line at 3.9 infections per 100 person years, with the relative rate in the active arm according to TFV-DP concentrations (x-axis). Dashed lines represent the 95% confidence intervals. The IQR of TFV-DP concentrations associated with directly observed dosing in STRAND are provided as colored panels overlying the curves.

