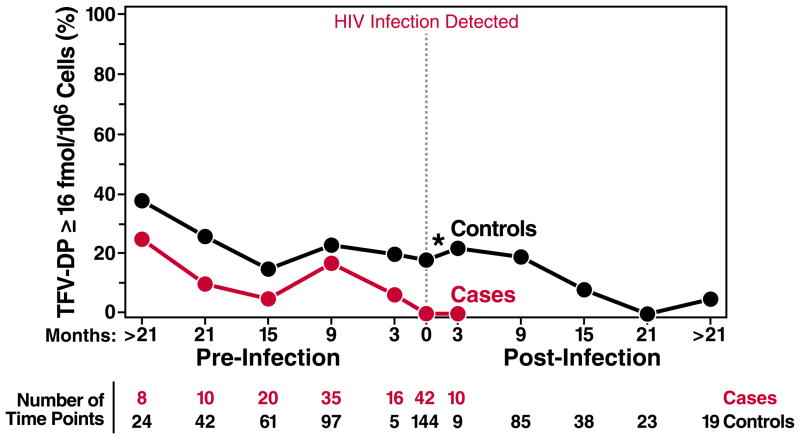
Fig 4.
The % of case and control time points with TFV-DP ≥ 16 fmol/M viable PBMC (estimated EC90). Dark-toned circles represent HIV-negative controls, and red circles represent HIV infected cases. The x-axis represents time relative to the visit with first evidence of HIV infection in the case and the matching time point in controls. Pre- and post-HIV infection time points were divided into those within 3 months (90 days) before or after HIV infection, and those within 6 month intervals distal to these time points. The number of time points with vPBMC tested for TFV-DP is listed for each time period. *indicates significant differences between cases and controls (P<0.05).

