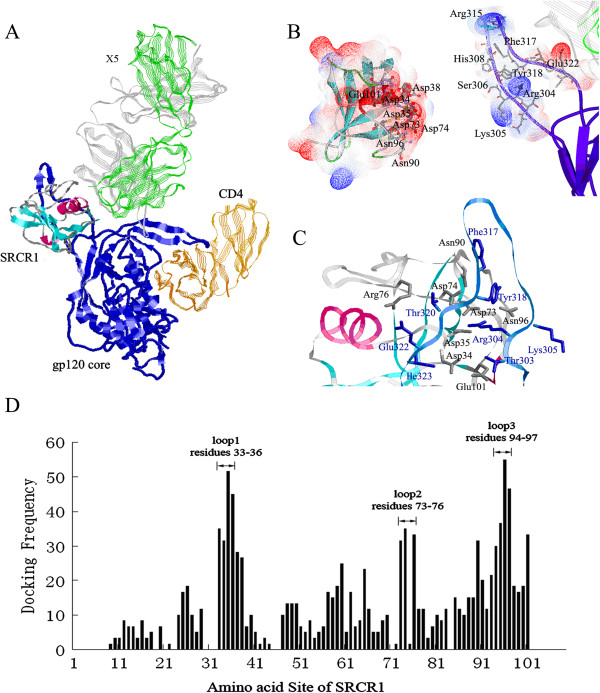
Figure 2.
Docking of SRCR1 with monomeric gp120-CD4-X5 complex. A) The structure of the docked SRCR1. SRCR1 and the gp120 core (in blue) are shown in solid ribbon style. CD4 and X5 are represented in silk ribbon style with orange (CD4), green (X5 light chain) and grey (X5 heavy chain), respectively; B) Electrostatic surface of SRCR1 (left) and the V3-loop of gp120 (right). The molecular surfaces of both SRCR1 and the V3-loop of gp120 are colored according to the calculated electrostatic surface potential with negative charges in blue, neutral in white, and positive charges in red; C) The closer view of the gp120-binding sites. The residues in SRCR1, which make contact with gp120, are shown as sticks in grey, whereas the residues in gp120 are colored in blue; D) The docking frequency of residues 1–109 in SRCR1. Three high docking frequency loop regions 33–36, 73–76 and 94–97 are indicated.

