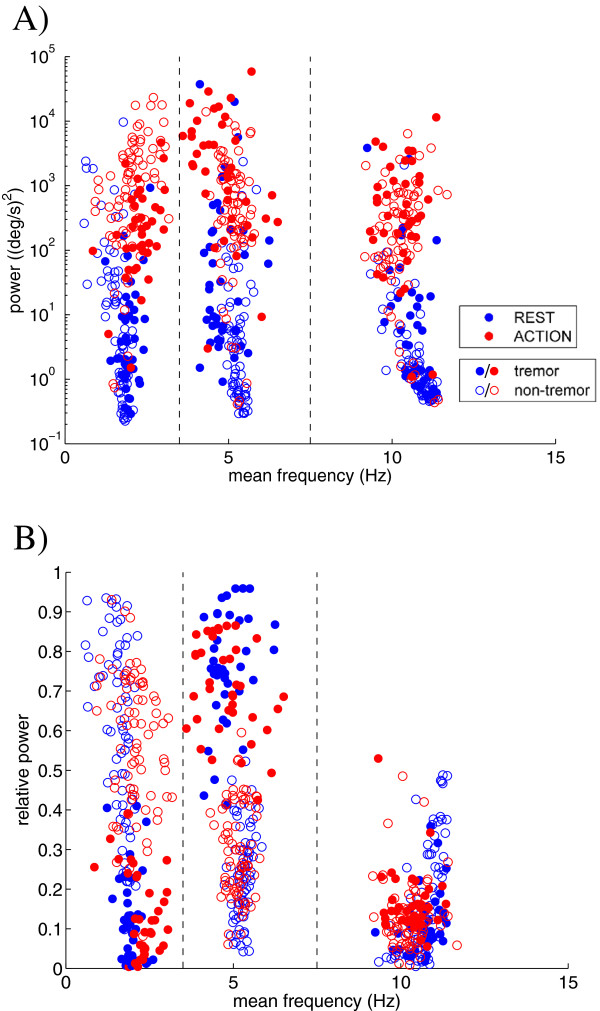
Figure 3.
The power-frequency relationship within the frequency bands. The absolute (A) and relative (B) power of the angular velocity signals as a function of the mean frequency in the low frequency band (<3.5 Hz), the pathological tremor band (3.5-7.5 Hz), and the normal physiological tremor frequency band (7.5-15 Hz) for the tremor (closed markers) and non-tremor (open markers) windows of the rest tremor test (i.e. rest tremor; blue markers) and the action tremor test (i.e. the tapping movement and action tremor; red markers), respectively. Each marker represents a single extremity of an individual patient at a particular setting of the stimulator. Note that the absolute power in figure A is plotted on a logarithmic scale. According to the sensor specifications the power of sensor noise is around 0.0025 (deg/s)2/Hz, and thus recorded signals were well above noise level.

