
FIGURE 1.
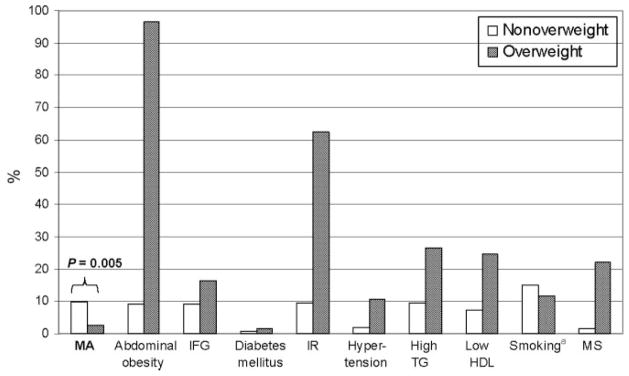
Prevalence of microalbuminuria and cardiovascular risk factors in adolescents according to BMI category. MA indicates microalbuminuria; TG, triglyceride level; LDL, low-density lipoprotein level; IFG, impaired fasting glucose level; IR, insulin resistance; MS, metabolic syndrome. Except where indicated, P < .05 for all comparisons between nonoverweight and overweight adolescents. a P = .3.