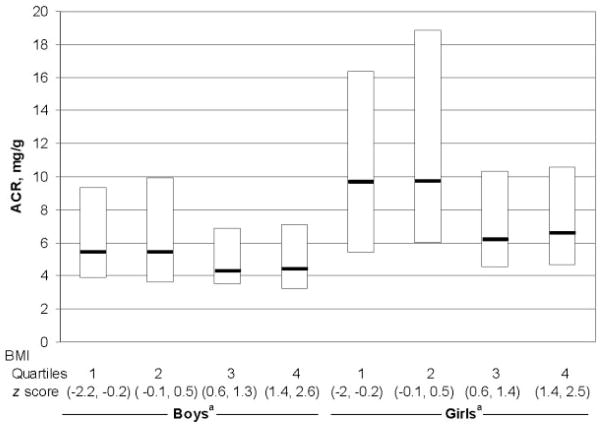
FIGURE 2.
Box plot of ACR of adolescents according to gender and BMI z-score quartiles. Shown are the 25th, 50th, and 75th percentiles of ACR distribution for boys and girls without microalbuminuria according to age group. The boxes enclose the 25th to 75th percentile, and the middle horizontal lines represent the median values. a P < .05 for trend.

