Fig. 1.

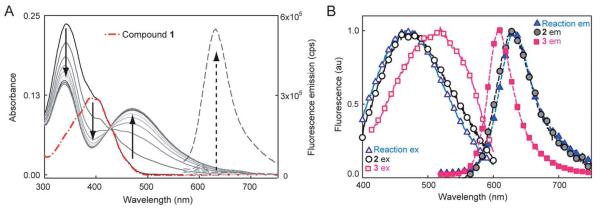
(A) Spectral change during the NTR reaction with 1 and NADH over ≈10 minutes showing red-shifted absorption and fluorescence increase. Solid curves show absorbance of the reaction mixture at different time points, broken red curve is absorbance of 1 alone. Dashed lines are fluorescence emission (500 nm excitation) before and after the NTR reaction. No fluorescence turn-on or absorbance change is observed without all three components, see ESI Fig. S2 and S3.† (B) Normalized excitation (solid curves and empty symbols, collected at emission max) and emission (dashed curves and solid symbols, 500 nm excitation) spectra of NTR reaction mixture (triangles) compared to separately synthesized 2 (circles) and 3 (squares). All spectra measured in 10 mM Tris–HCl (pH 7.5), for more details, see ESI.†
