Fig. 4.

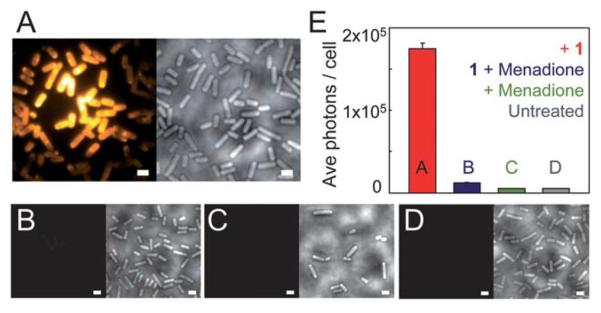
(A) B. subtilis incubated with 5 μM of 1. Left image: average fluorescence; right image: corresponding white light image of cells. All cells become fluorescent; cells in the center are brighter because the laser excitation spot is more intense in the center. Images in the controls (B)–(D) are structured similarly: left image is average fluorescence at same contrast scale as (A), and right image is corresponding white light image. (B) B. subtilis incubated with both 1 (5 μM) and menadione (0.2 mM), showing a dramatic fluorescence reduction. The images in (C) show cells incubated with only menadione, and part (D) shows untreated B. subtilis. (E) Quantification of number of photons detected per cell (~300 cells per condition) for each case. All scale bars are 2 μm, imaging intensity is 2.5 kW cm−2. All conditions were incubated for 30 minutes. For more details on incubation and imaging conditions, see ESI.†
