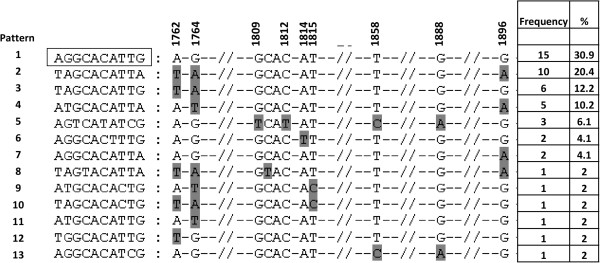
Figure 4.
Mutation distribution in the basic core promoter/precore region, at 11 loci of interest (1762, 1764, 1809–1812, 1814, 1815, 1858, 1888 and 1896), of 49 genotype D or E HBV isolates from HBeAg-negative patients. Boxed motif represents the wild- type of genotypes D or E. Data were obtained using the Mutation Reporter Tool [36]. Mutations are shaded in grey. The frequency of the mutational patterns did not differ between genotype D and E.

