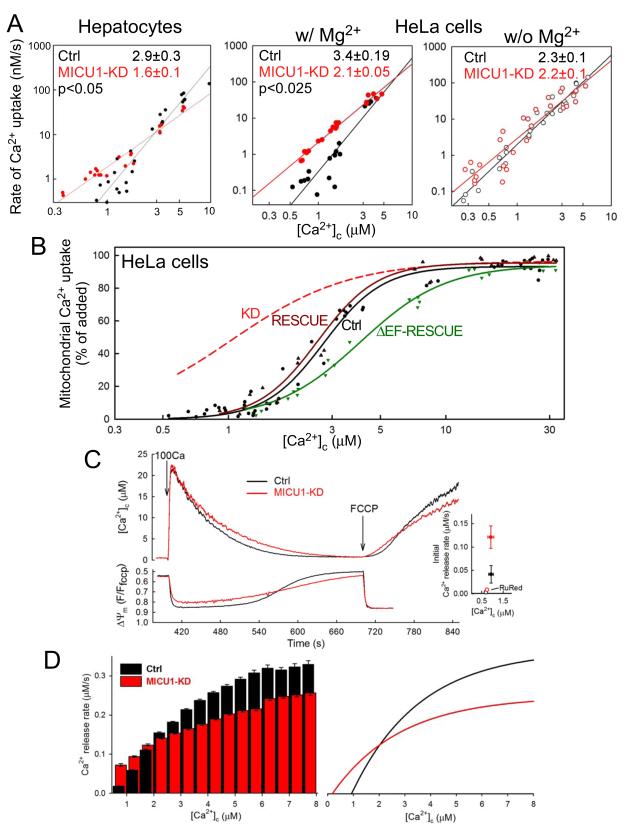
Fig3. MICU1 contributes to cooperative activation of mtCU.
(A) Double logarithmic plots of initial Ca2+ uptake rates vs. [Ca2+]c in Ctrl and MICU1-KD hepatocytes (left) and stable HeLa cells in the presence (middle) and absence of Mg2+ (right). Slope of linear fit for each data set is shown (n=3). (B) [Ca2+]c dose-responses of the fractional mitochondrial Ca2+ uptake in Ctrl, RESCUE and ΔEF-RESCUE HeLa cells. Data points from individual recordings (≥3 for each Ca2+ dose) and a sigmoid (logistic) fit to each data set are shown. The sigmoid fit for MICU1-KD cells from Fig2D is shown as a reference (red). (C) [Ca2+]c (top) and ΔΨm (bottom) time courses showing the mitochondrial clearance of a 100 μM CaCl2 pulse (100Ca) and subsequent FCCP-induced Ca2+ release in suspensions of permeabilized HeLa cells. Inset: mean initial Ca2+ release ([Ca2+]c rise) rates from recordings where by the time of FCCP addition [Ca2+]c dropped below 1.2 μM (Means±S.E., n=3). Rates obtained from recordings in the presence of RuRed (3 μM) added 30 s before FCCP are shown with open symbol. (D) Left: Instantaneous rate of FCCP-induced Ca2+ efflux at each [Ca2+]c (0.5μM binning) obtained via differentiation of the initial period of the [Ca2+]c rises (n=7). Right: Instantaneous Ca2+ release rates extrapolated from compilation of differentiated sigmoidal (logistic) fits. Predicted 0 crossings (the effective thresholds) are 937 and 185 nM for Ctrl and MICU1-KD, respectively.

