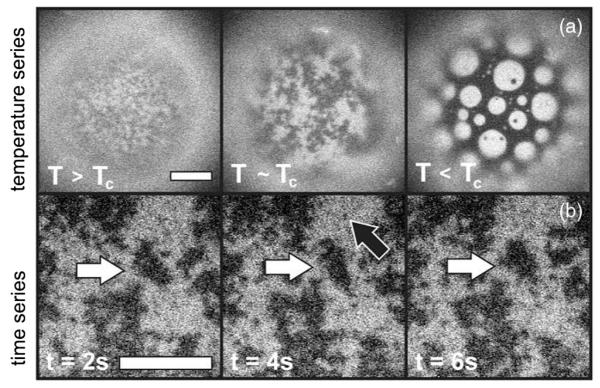
FIG. 1.
Fluorescence micrographs of vesicles of diameter 200 μm. (a) As temperature changes from T > Tc (T = 31.25 °C, Tc ≈ 30.9) to T ~ Tc (T = 31.0 °C), fluctuations in lipid composition grow. Below Tc, at T = 28 °C, domains appear. Scale bar = 10 μm. (b) A movie of composition fluctuations within a vesicle above Tc. Large fluctuations persist for seconds (white arrows), whereas small ones disappear by the next frame (black arrow). Scale bar = 20 μm.

