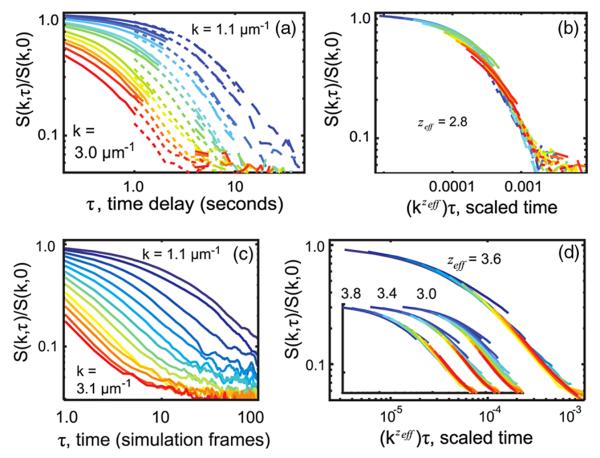
FIG. 2.
(color online). (a) and (b) Rescaling experimental data closest to Tc by kzτ collapses all curves to zeff = 2.8, with consistent model HC. Normalized structure factors are shown for ξ = 13 ± 2.2 μm and three video rates: 10 frames per second (fps, solid lines), 2 fps (short dashed lines), and 0.5 fps (long dashed lines). Colors denote wave numbers k = 1.1 μm−1 (top curve, blue) to 3.0 μm−1 (bottom curve, red). (c) and (d) Simulations solely to verify technique. Structure factors of Kawasaki dynamics at T = Tc blurred in time to mimic experimental limitations collapse at zeff = 3.6 ± 0.2, consistent with z = 3.75 for 2D model B. Colors range from k = 1.1 μm−1 to 3.1 μm−1. Insets show collapses used to determine bounds for zeff and failure of collapse at zeff = 3.

