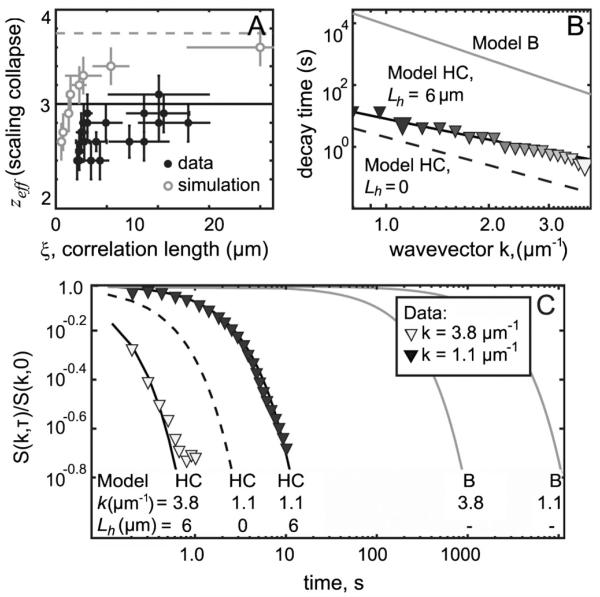
FIG. 3.
Data are in excellent agreement with model HC. (a) Filled symbols: dynamic exponent zeff from scaling collapse of experimental data as in Figs. 2(a) and 2(b). Open symbols: model B simulation in which zeff approaches 3.75. (b) Decay time, defined as when S(k, τ)/S(k, 0) = e−1 Large symbols indicate wave numbers 1.1 and 3.3 μm−1. (c) Normalized structure factors S(k, τ)/S(k, 0). In panels (b) and (c), experimental data denoted by symbols, 2D model B by gray lines, model HC (HC) with Lh = 6 μm by solid lines, and model HC with Lh = 0 by a dashed line.

