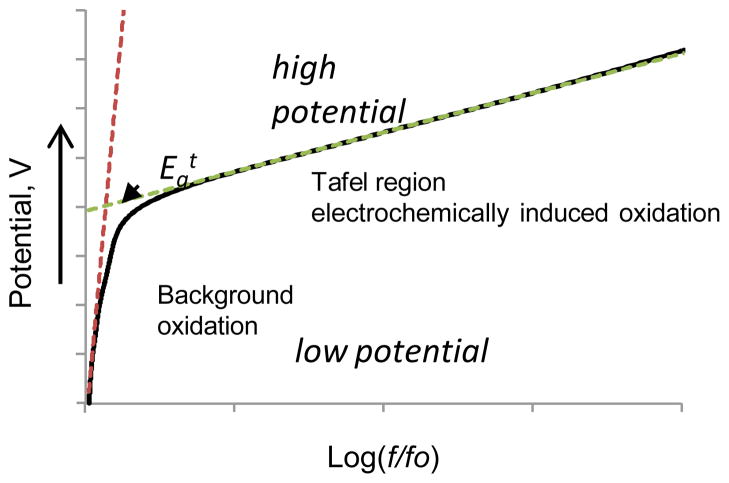
Fig. 2.
Typical Tafel plot of a hypothetical leuco-dye oxidation under electrochemical condition. Low potential region corresponds to a non-or minimally fluorescent solution at low potentials. High potential region corresponds to the oxidation. The linear part of this region is known as a Tafel region. Egt can be found as a Y coordinate of a cross-section of the two slopes.

