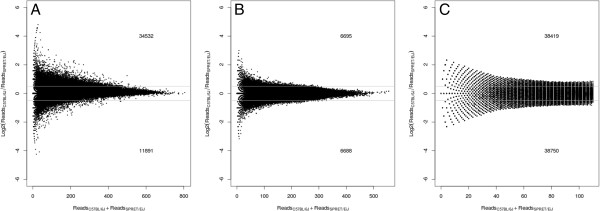
Figure 2.

Evaluation of allelic bias in capture efficiency. MA plots comparing the number of sequencing reads that overlapped with a target derived from C57BL/6 J with that from SPRET/EiJ allele based on exome sequencing (A), simulated data (B) or WGS (C). The sum of the number of sequencing reads that could be mapped only to either genome was plotted on the X axis, and the log2 transformed ratio between the number of reads derived from C57BL/6 J and that from SPRET/EiJ allele was on the Y axis. The numbers of targets with log2 transformed ratio > =0.5 or < = −0.5 were shown in the respective figure. In exome sequencing, the reads mapped only to C57BL/J were clearly overrepresented whereas such bias did not exist in the simulated or WGS data.
