Figure 4.

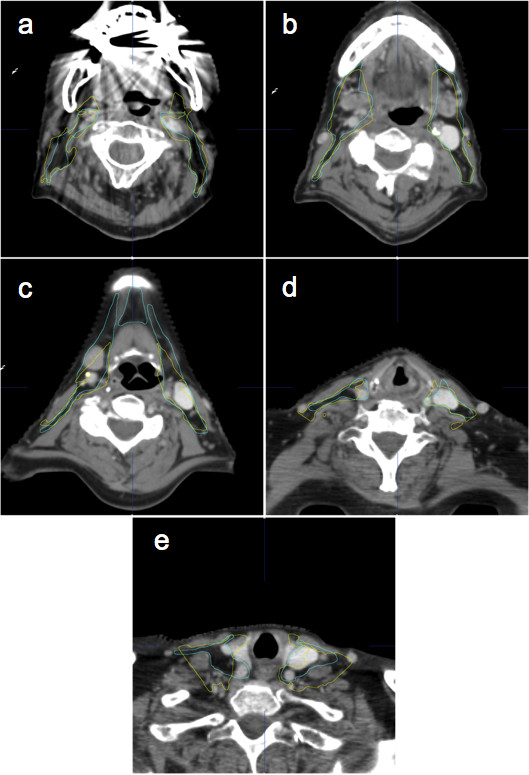
Selected CT slices of patient 12 (N0-stage) with automatic (yellow lines) and manual (blue lines) segmentations. Levels depicted bilaterally in the different panels: a= 2; b and c = 1b and 2; d = 3; e = 4.

Selected CT slices of patient 12 (N0-stage) with automatic (yellow lines) and manual (blue lines) segmentations. Levels depicted bilaterally in the different panels: a= 2; b and c = 1b and 2; d = 3; e = 4.