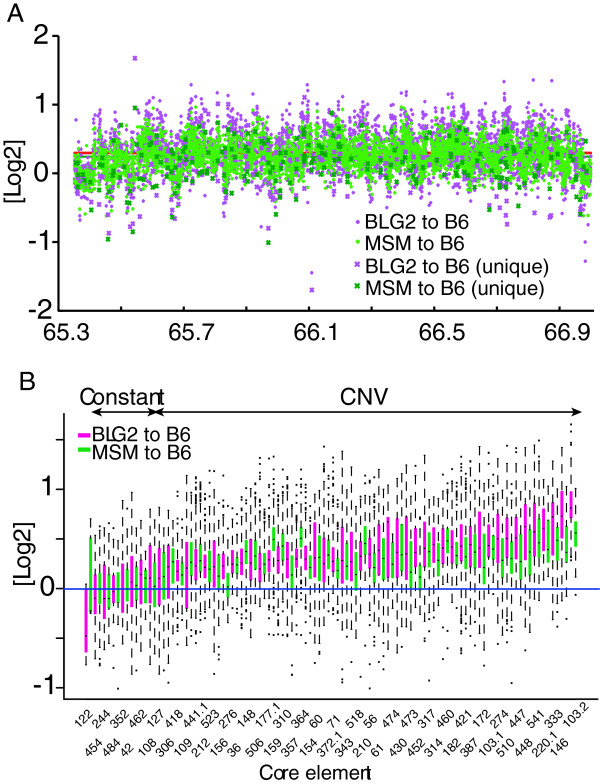
Figure 5.
Copy number analyses of core elements. (A) Results of aCGH for the entire SD13M region. Mapped aCGH log2 values in SD13M that compare MSM (musculus subspecies group) or BLG2 (musculus) with B6 (domesticus) are shown by green and magenta diamonds, respectively. Relative copy numbers estimated by with unique probes are shown by X in the same colors. Average aCGH values for MSM compared with B6, and for BLG2 compared with B6 in the relevant regions are shown by red and green lines, respectively. (B) Boxplots of aCGH log2 values mapped on each core element. Boxplot of aCGH values for BLG2 compared with B6, and of MSM compared with B6 are shown in magenta and green, respectively. Dots indicate outliers. The boxplots are aligned in the order of the average aCGH values from the comparison of BLG and B6.

