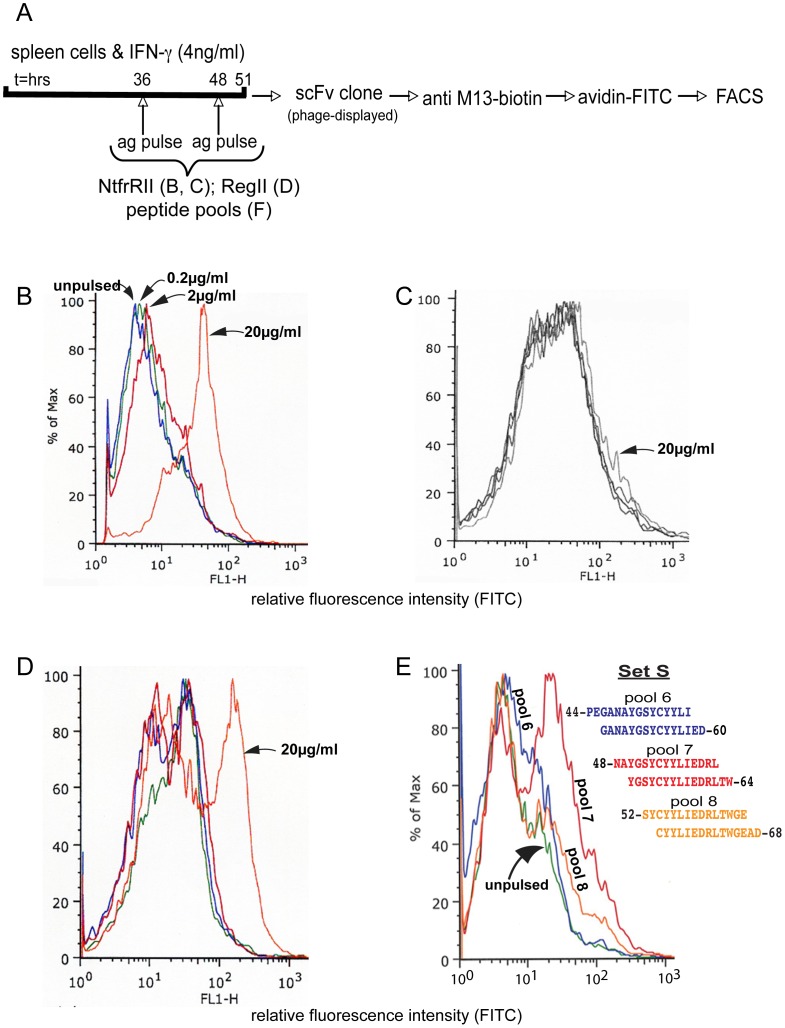
Figure 2. BscFv clone D9, an idiotype that binds I-Ag7 NtfrRII peptide complexes and identifies an NtfrRII-derived T-cell epitope.
scFv clones were characterized to establish that they represent the desired idiotype. Here the idiotype should recognize an NtfrRII (RegII)-derived epitope presented in the context of I-Ag7 but it should not bind to the surface of spleen cells presenting NtfrRII-derived epitopes in the context of other classII MHC alleles. BscFv clone D9 was used as primary antibody to stain antigen-pulsed and unpulsed spleen cells according to the protocol shown in A. IFN-γ was added to the spleen cells to enhance expression of I-Ag7. Spleen cells of NOD mice were pulsed with NtfrRII at the indicated concentrations and stained with D9 (B). Spleen cells of B10 HTG H-2g mice (Kd/Db/I-Ad/I-Ed) expressing different classII MHC alleles but the same classI alleles as NOD mice (Kd/Db/I-Ag7) pulsed with the same doses of NtfrRII failed to bind D9 (C). Spleen cells of NOD mice pulsed with full-length RegII also bound D9 at the highest pulse dose (D). The staining protocol on NtfrII-pulsed vs. unpulsed NOD APCs (B) was performed routinely to characterize newly produced batches of phage-displayed scFvs and the graph shown is representative of one of the batches. Pulse conditions used in (C) and (D) were tested with three different batches of D9 (representative graphs are shown). In order to map the NtfrRII-derived epitope recognized by D9 in the context of I-Ag7, NOD spleen cells were pulsed with pools each consisting of two overlapping peptides of set S (Table S6 in File S4) covering NtfrRII. They were stained with D9 and analyzed by flow cytometry. D9 preferentially bound to APCs pulsed with pool 7 (peptides 48–62 and 50–64) and weakly to APCs pulsed with pool 6 (peptides 44–58 and 46–60) or pool 8 (peptides 52–66 and 54–68) (E). Spleen cells pulsed with peptide pools outside the region 44–68 did not stain with D9. The graph (E) is representative of three independent staining runs performed on NOD spleen-cells pulsed with the peptide pools 6 or 7 or 8 of set S.

