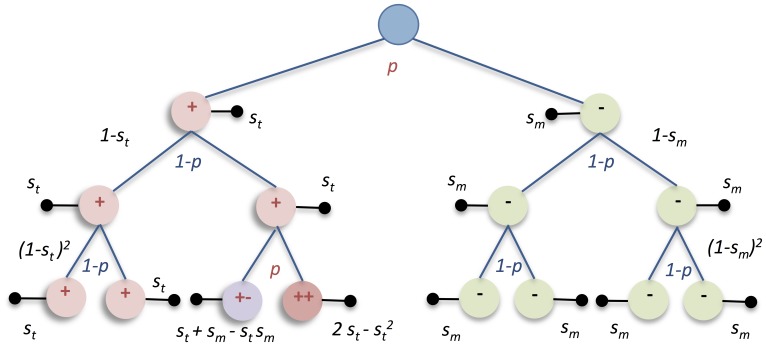
Figure 2. Example of the discrete time branching process in Chiron.
Aneuploidy is generated at a specific rate (p) of mitotic mis-segregation, where trisomic (red circles) and monosomic cells (green circles) have certain probabilites (s t and s m respectively) of permanent proliferative arrest/death (black horizontal bars) at each mitotic cycle. Two or more aneusomies will result in increased probabilities of arrest/death as exemplified by cells labelled++and +−.

